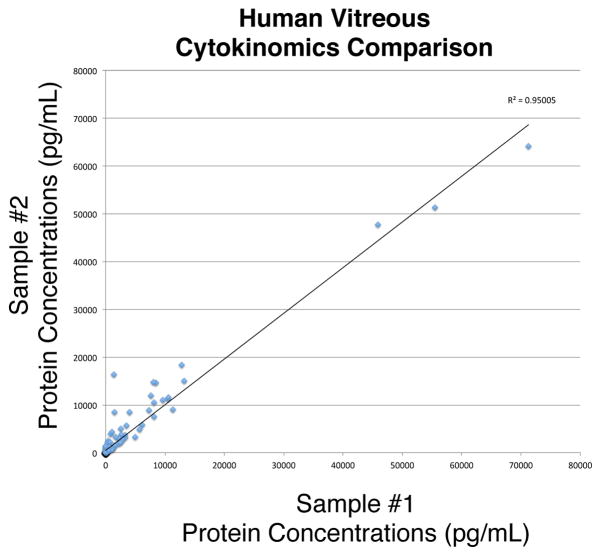
Figure 8. MORLI validation example.
Cytokinomics of vitreous samples collected and stored according to the protocols outlined in this manuscript. Two samples from patients with epiretinal membranes were collected and analyzed using multiplex ELISA cytokine arrays that measure the protein concentrations of over 200 different cytokines. The protein concentrations identified in the samples were graphed in this scatter plot. The two axes represent the two different samples. The linear regression correlation coefficient indicated that the two samples have similar protein concentrations as expected. If the samples had been collected from patients with poor phenotype data or with different protocols, the correlation would have been less.

