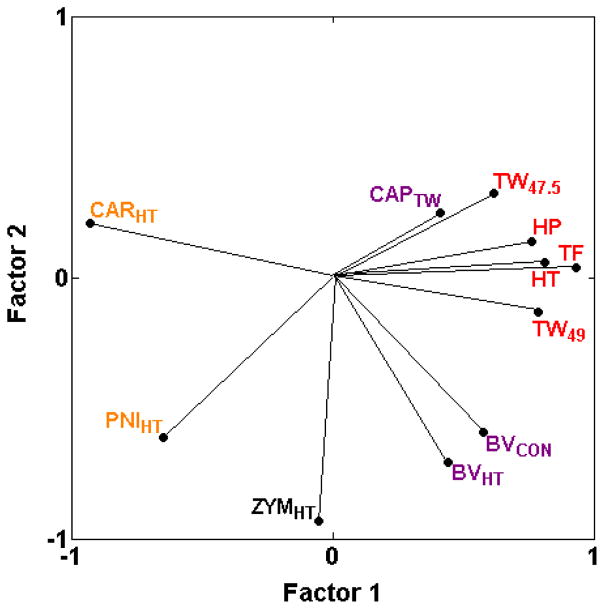
Fig. 3.
PCA plot of cross-correlations among heat nociception assays in naïve mice and heat hypersensitivity assays. Heat hypersensitivity assays show a continuous range of relationships with heat nociception, from high positive (CAPTW) to moderate positive correlations (BVCON and BVHT), through correlations close to zero (ZYMHT) to negative correlations (PNIHT and CARHT) (Table 2; [19,28]). Thus, heat hypersensitivity assays are more or less genetically related to thermal nociception assays along a continuum. The proportion of total variance accounted for is 0.67. Font color reference is as in Fig. 2 legend.

