
Figure 5. EWS-FLI1 target caveolin-1 expression reduced by racemic and (S)-YK-4-279 treated tumors.
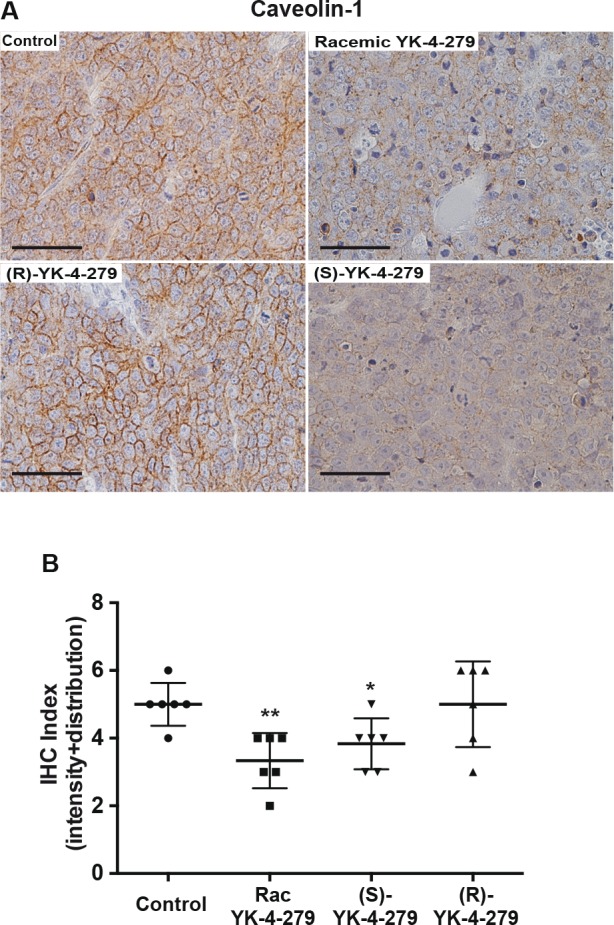
(A) Representative examples of caveolin-1 IHC staining from animals treated in Figure 4. Scale bar = 50 ¼m. (B) Pathologist quantification of cavelolin-1 IHC in two blinded scoring sessions evaluating staining intensity and distribution, 0 – 3. The sum is reported in this graph, ** control vs. racemic p=0.004, * control vs. (S)-YK-4-279 p=0.04.