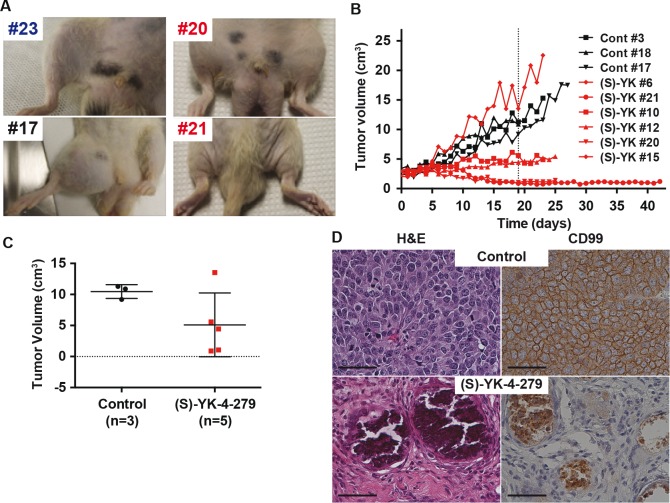
Figure 6. Rat orthotopic xenograft shows complete tumor regression with continuous infusion of (S)-YK-4-279.
(A) Images of tumors at endpoint of study (blue: normal rats, black: control treated rats, red: (S)-YK-4-279 treated rats). (B) ES1 xenograft tumors were treated with continuous IV infusion of either control or 72 mg/kg/day (S)-YK-4-279 for 8 of 9 days per cycle (S)-YK-4-279 when tumors reached 2.5 cm3 in rats (Control: black and (S)-YK-4-279: red). (C) H&E and CD99 staining of rat xenograft with continuous IV treatment with control or 72 mg/kg (S)-YK-4-279 for 8 of 9 days per cycle. Scale bar = 50 ¼m. (D) Tumor volume on day 19 from start of treatment, control vs (S)-YK-4-279 p=0.08.

