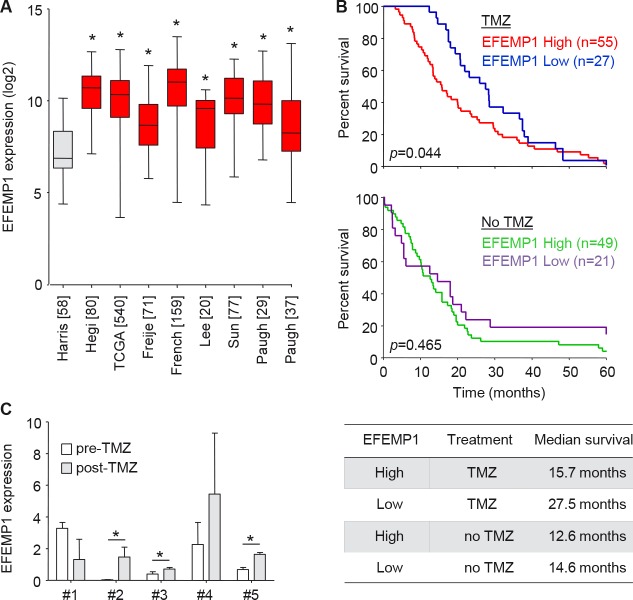
Figure 6. EFEMP1 expression correlates to TMZ treatment efficacy and survival in glioblastoma patients.
A, EFEMP1 expression levels in multiple publicly available glioblastoma datasets as visualized by using R2 (R2.amc.n1). Glioblastoma datasets (red) [28–34] were compared to normal brain (grey) [27]. [Number of patients] included in dataset are shown. B, survival of glioblastoma patients with high- (red and green), or low (blue and purple) EFEMP1 expression was plotted for TMZ-treated (n=82, upper panel) or non-treated (n=70, lower panel) patients (www.rembrandt.org). C, EFEMP1 mRNA expression levels in patient samples upon clinical progression following TMZ treatment (post-TMZ), compared to matching samples biopsied at diagnosis (pre-TMZ). Numbers (#) represent individual glioblastoma patients. Expression levels were normalized to expression in non-neoplastic brain tissue. Shown are averages, error bars indicate SD. *p<0.05 t test.

