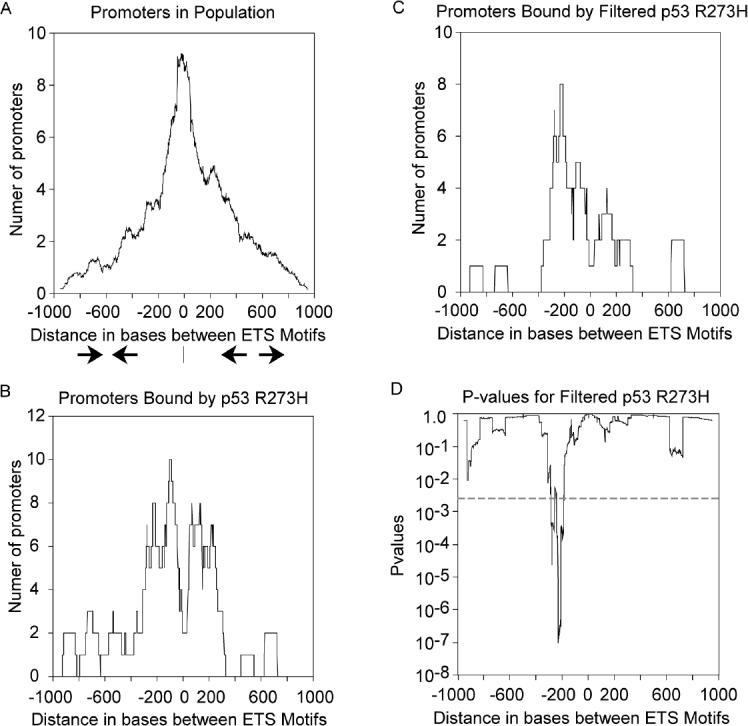
Figure 4. p53 R273H exhibits preferred binding to promoters with distantly spaced ETS motifs.

A. The distribution of distances between pairs of ETS motifs within all promoters is shown in a density plot. The distance range is from −1000 bps to + 1000bps based on the negative or positive distance between motifs oriented either face-to-face, or back-to-back, respectively. A diagram is shown with face-to-face arrows depicting the orientation of motifs on the negative side, while back-to-back arrows depict the orientation of motifs on the positive side. B. A density plot shows p53 R273H binding preference to promoters with distantly spaced ETS motifs in contrast to panel A. C. A density plot is shown for preferred binding by p53 R273H with high signal to distantly spaced ETS motifs. D. A plot is shown for p-values calculated for the corresponding p53 R273H binding in panel C in comparison to randomly sampled distributions. The dotted line corresponds to an alpha corrected for multiplicity of analysis.
