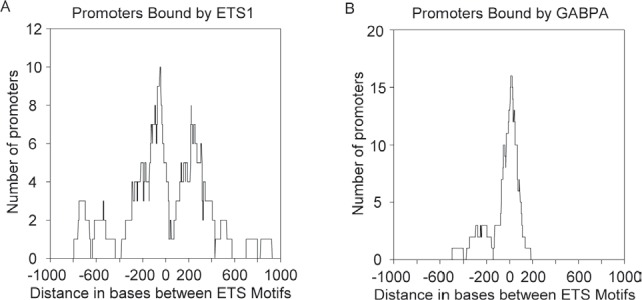
Figure 5. ETS1 exhibits preferred binding to promoters with distantly spaced ETS motifs while GABPA exhibits preference for promoters with closely spaced ETS motifs.

A. A density plot shows ETS1 binding preference to promoters with distantly spaced ETS motifs. B. A density plot shows GABPA binding preference for promoters with closely spaced ETS motifs.
