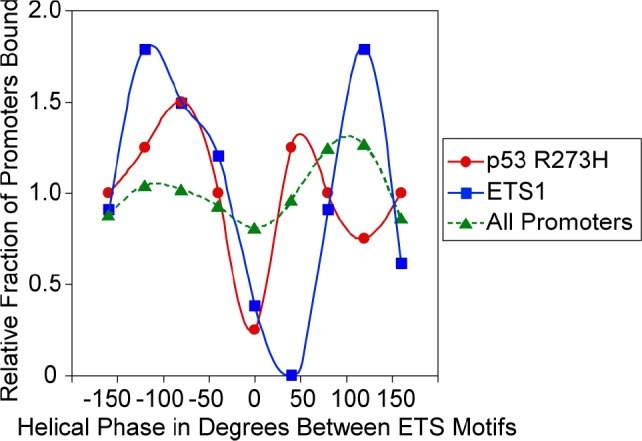
Figure 6. p53 R273H and ETS1 exhibit preferred binding corresponding to the helical phase between ETS motifs.

A plot is shown of the relative fraction of binding for p53 R273H (red) and ETS 1 (blue) as they relate to the helical phase between pairs of ETS motifs within promoters. The helical phase between pairs of ETS motifs for all promoters (green) is shown for comparison. Points are based the average relative binding for a window size of 40°. Smooth curves were fitted to the data.
