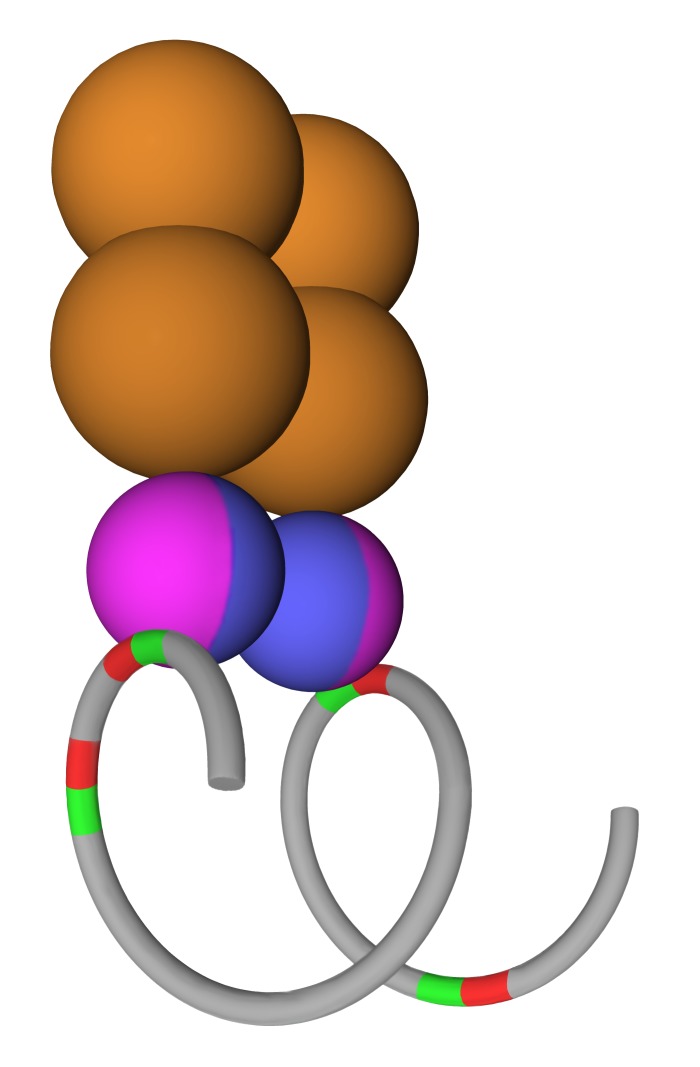
Figure 7. The DNA Loop Preclusion Model.
A proposed model is shown for ETS1 and p53 R273H binding to two inverted ETS1 binding sites. A DNA helix is shown in grey formed in a loop with four ETS1 binding sites shown in red and green (for orientation). Two ETS 1 monomers shown in lavender and blue are bound as a homodimer to two ETS1 binding sites. A p53 R273H tetramer is shown in orange bound to the ETS1 homodimer. Two ETS 1 binding sites are left unbound.

