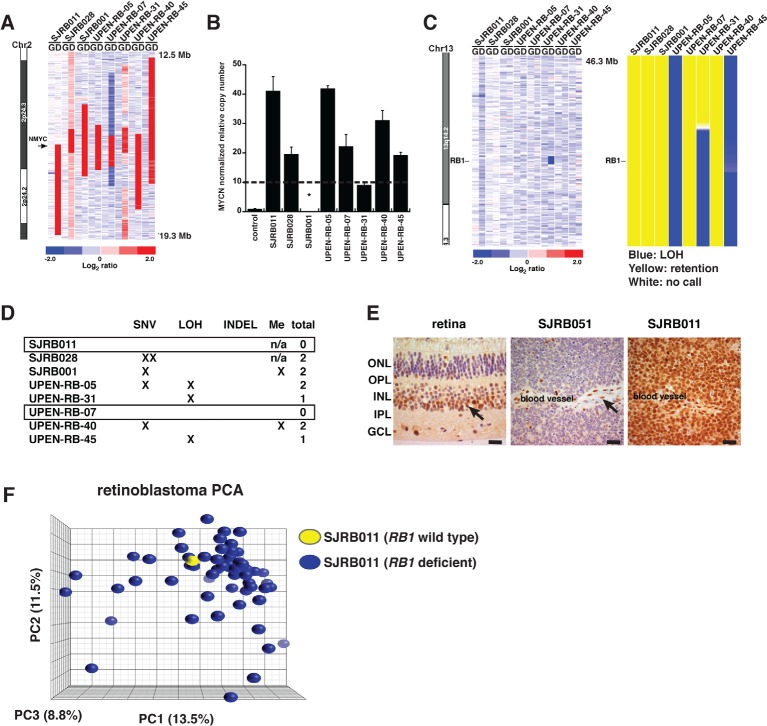
Figure 4. RB1 Gene Analysis in Retinoblastomas with MYCN Amplification.
(A) Inferred log2 ratio normalized signal for germline and diagnostic DNA samples for samples with MYCN gene amplification. (B) One of the samples indicated by an (*) was previously validated to have a MYCN amplification (SJRB001). Validation of MYCN amplification in the remaining 7 samples using quantitative real-time PCR with a cutoff of 10 copies (dashed line). (C) Inferred log2 ratio for tumor and normal samples and loss of heterozygosity (LOH) for the RB1 gene as measured by SNP 6.0 analysis. (D) Table summarizing single nucleotide variations (SNV), loss of heterozygosity (LOH), promoter hypermethylation and insertions/deletions (INDEL) at the RB1 locus. (E) Immunohistochemistry for RB1 in normal retina, SJRB051 with biallelic RB1 loss and SJRB011 with wild type RB1. Arrows indicate RB1 immunopositive cells in the normal retina and vascular endothelial cells. (F) PCA plot of gene expression array analysis for the RB1 wild type sample (SJRBO11, yellow) and RB1 deficient retinoblastomas (blue). Scale bars in (E): 10μm.

