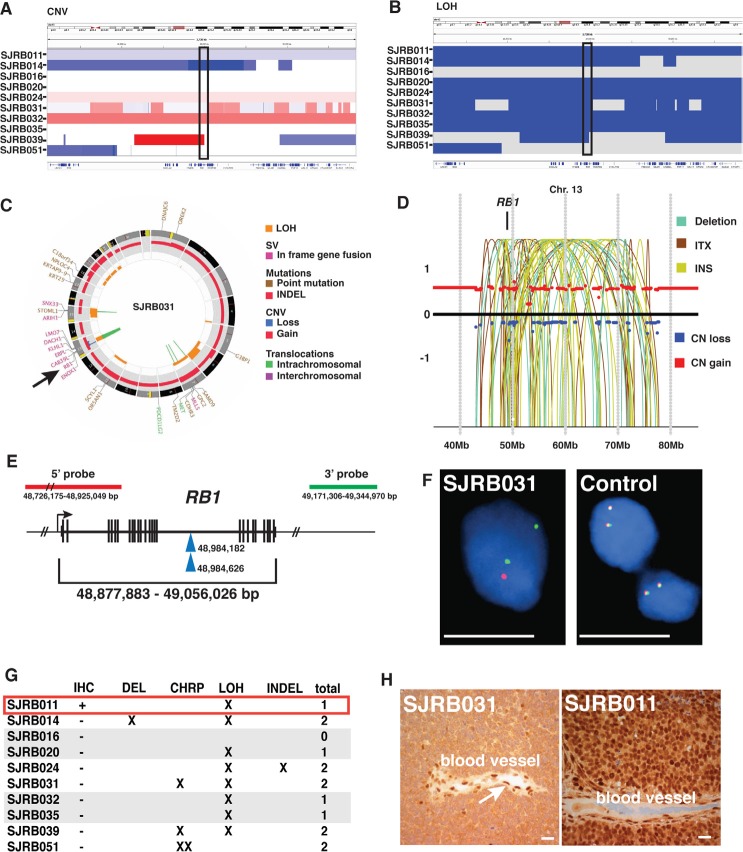
Figure 5. Whole Genome Sequence Analysis of Retinoblastoma.
(A) Copy number alterations on chromosome 13 spanning the RB1 gene (box). Blue indicates a loss and red indicates a gain. (B) LOH analysis on chromosome 13 spanning the RB1 locus (box). Blue indicates LOH and white indicates normal diploid copy number. (C) CIRCOS plot of SJRB031 with chromothripsis at the RB1 gene (arrow). (D) Half-oval chromothripsis plot of copy number gain (red) and loss (blue) and deletions (gray lines), intrachromosomal translocations (red lines) and insertions (yellow lines). (E) Position of the 5′ and 3′ FISH probes used for 2-color FISH of the RB1 gene. Blue arrowheads indicate the breakpoints in SJRB031 in the RB1 gene. (F) FISH for the 5′ (red) and 3′ (green) probes for the RB1 gene on one sample with chromothripsis (SJRB031) and a normal control (tonsil). (G) Summary of results for immunohistochemistry for RB1 (IHC), deletion analysis (DEL), chromothripsis (CHRP), single nucleotide variation (SNV), loss of heterozygosity (LOH), small insertions/deletions (INDEL) in the RB1 gene in each of the 10 samples. The red box indicates the one tumor among 94 with wild type RB1 and expression of RB1 protein. The gray boxes indicate those with one intacti RB1 gene but no RB1 protein by IHC. (H) Immunohistochemistry for RB1 in SJRB031. Scale bars in F,H: 10¼m.

