
Figure 5. Microarray gene expression data.
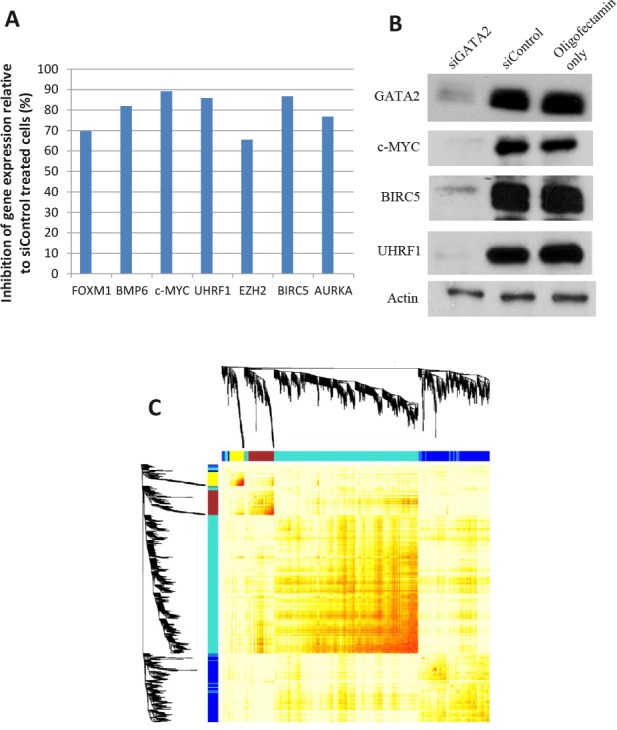
A number of genes were validated for gene expression changes by A, qRT-PCR and/or B, Western blot analysis. C, weighted gene co-expression network analysis to identify genes that are potentially regulated by GATA2. The 4 modules of genes showing high correlation, as indicated by unsupervised hierarchical clustering, were assigned different colors.