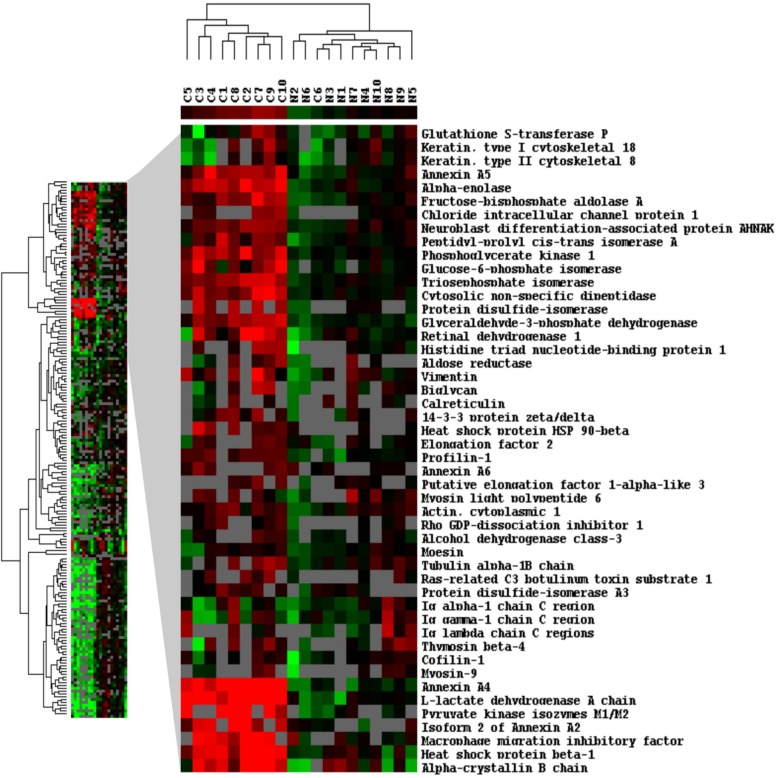
Figure 1. Hierarchical clustering analysis of dysregulated proteins between ccRCC and normal kidney tissues.
Clustering analysis was performed based on 345 proteins for which quantitative information was available. The samples clustered into two main groups: one that contained the 9 of 10 ccRCC samples (C1-C5, C7-C10); and second contained all normal samples (N1-N10) plus one cancer sample; C6. The difference in expressions of dysregulated proteins between ccRCC and normal kidney samples was statistically significant (p<0.001).

