Fig. 2.
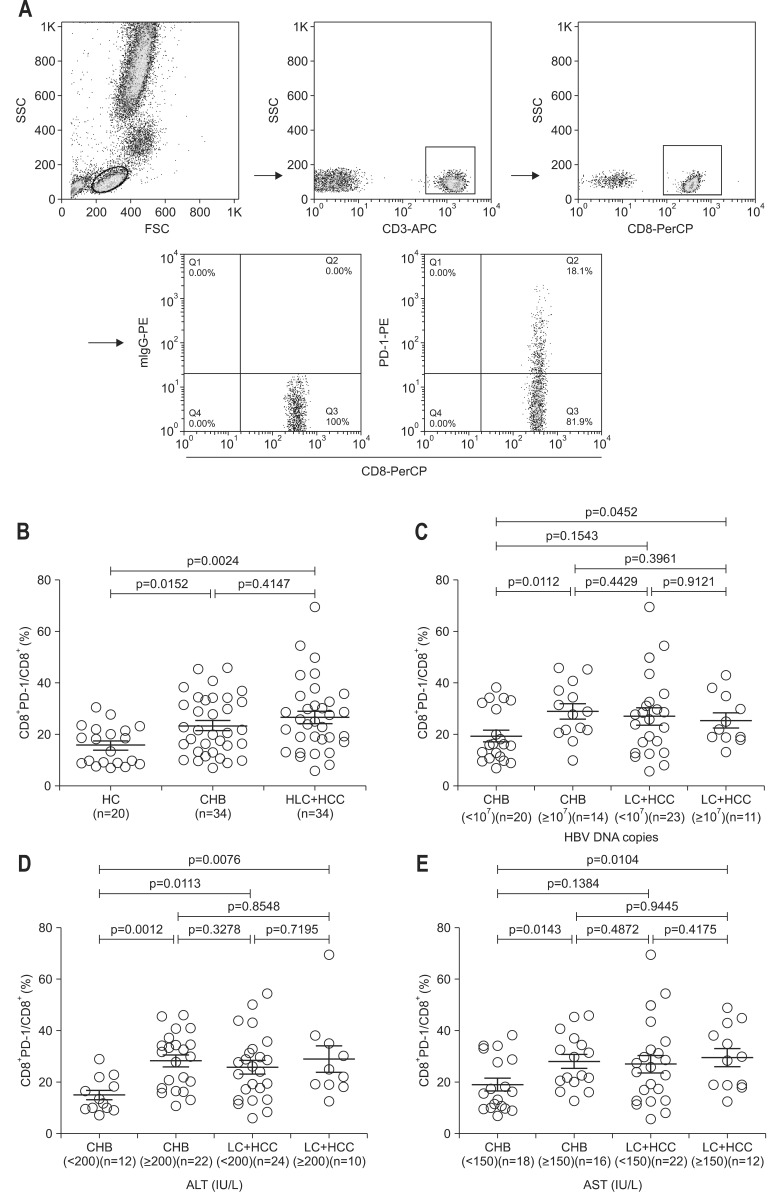
Gating strategy and expression profiles of programmed death-1 (PD-1) in peripheral CD8+ T cells of chronic hepatitis B (CHB) virus, liver cirrhosis (LC), and hepatocellular carcinoma (HCC) patients. (A) The gating strategies and representative results of PD-1 expression in CD8+ T cells are shown. (B) Statistical results for PD-1 expression in circulating CD8+ T cells from healthy control (HC), CHB, and LC plus HCC are shown. (C, D, E) The percentages of CD8+ PD-1+ T cells in CHB and LC plus HCC patients are organized according to the hepatitis B virus (HBV) DNA load and alanine aminotransaminase (ALT) and aspartate aminotransferase (AST) levels, respectively, as indicated in the figures.
SSC, side scatter; FSC, forward scatter; LC, liver cirrhosis.

