
Figure 5.
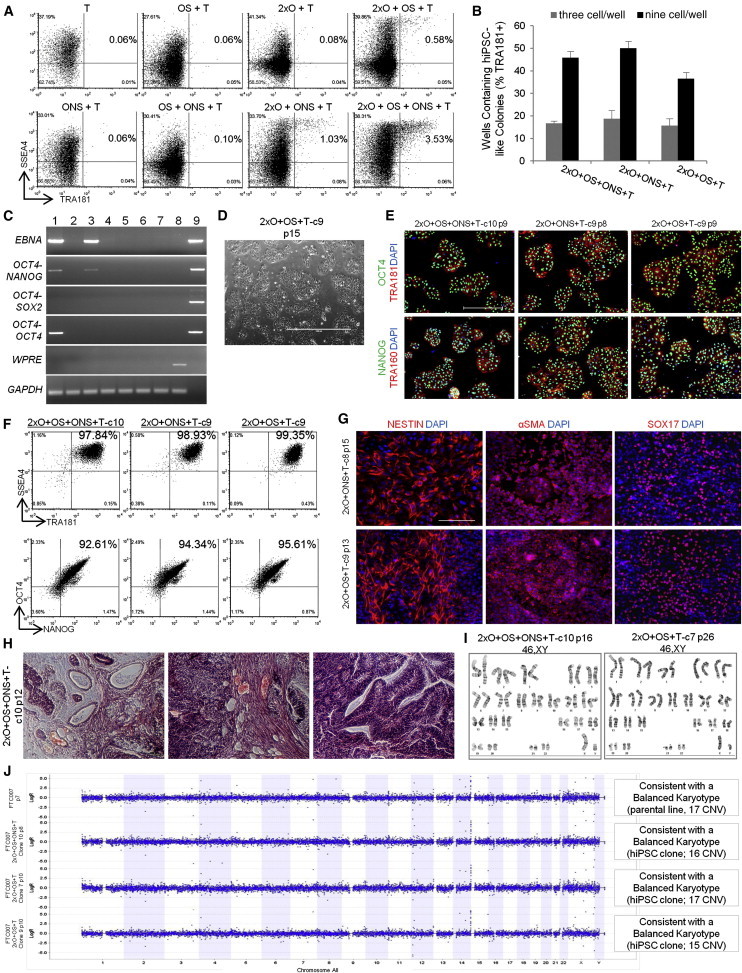
Derivation of hiPSC Clones with Minimal Number of Reprogramming Factors
(A) Flow cytometry profile of reprogramming kinetics induced by various gene combinations at day 13 post-induction.
(B) Histogram of hiPSC clones in wells of 96-well plate at three and nine cells per well. Three independent experiments were performed, with an SEM.
(C) PCR analysis for episomal DNA derived from various hiPSC clones. Lane 1 shows 2xO+OS+ONS+T-c7 p6, lane 2 shows 2xO+OS+ONS+T-c10 p6, lane 3 shows 2xO+ONS+T-c5 p5, lane 4 shows 2xO+ONS+T-c9 p5, lane 5 shows 2xO+OS+T-c7 p6, lane 6 shows 2xO+OS+T-c9 p6, lane 7 shows untransfected FTC007, lane 8 shows hiPSC generated using lentiviral constructs, and lane 9 shows episomal vector used as positive control. Input of 100 ng genomic DNA and 35 PCR cycles were used for all sets.
(D) Typical morphology. Scale bar, 1,000 μm.
(E) Pluripotency markers detected by immunofluorescence. Scale bar, 1,000 μm.
(F) Flow profile of hiPSC clones.
(G) Directed differentiation of selected hiPSC clones 72–96 hr post-induction. Scale bar, 500 μm.
(H) Histological sections of teratoma derived from hiPSC clone 2xO+OS+ONS+T-c10. Left panel shows endoderm, middle panel shows mesoderm, and right panel shows ectoderm. Scale bar, 200 μm.
(I) Cytogenetic analysis of 20 G-banded metaphase cells from various hiPSC clones maintained in FF and single-cell culture.
(J) Copy number variation as assessed by array-comparative genomic hybridization and SNP. Panel on the right represents interpretation summary of the data. CNV, copy number variation.
See also Figure S4.