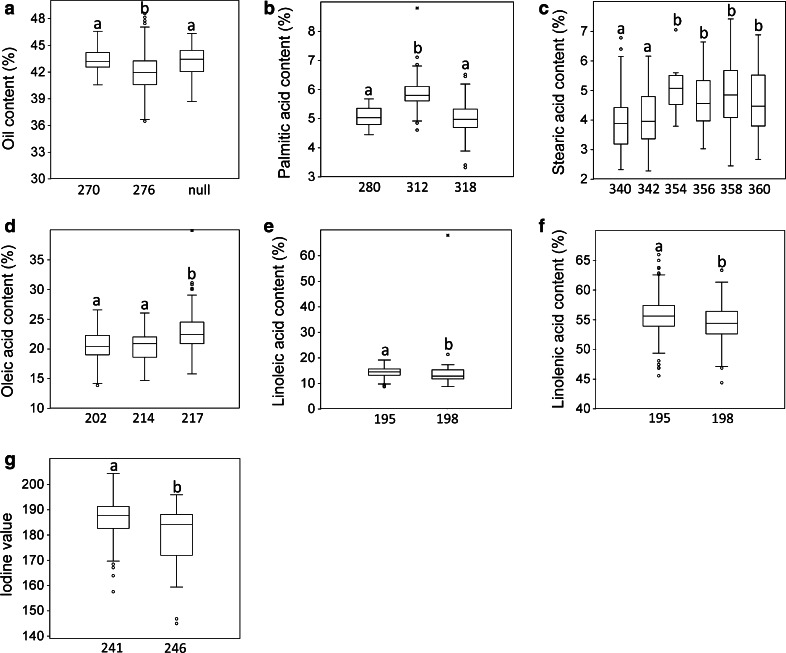
Fig. 2.
Comparison of allelic effects of seven consistent associated markers with seed quality traits in linseed. a Lu181 associated with oil content b Lu2534 associated with palmitic acid content c Lu146 associated with stearic acid content d Lu2555 associated with oleic acid content e and f Lu3262 associated with linoleic and linolenic acid content g Lu2102 associated with iodine value. Bottom values represent the allele size in base pairs. Box plots followed by the same letter do not differ statistically according to the Kruskal–Wallis test (α = 0.01)

