Figure 3.
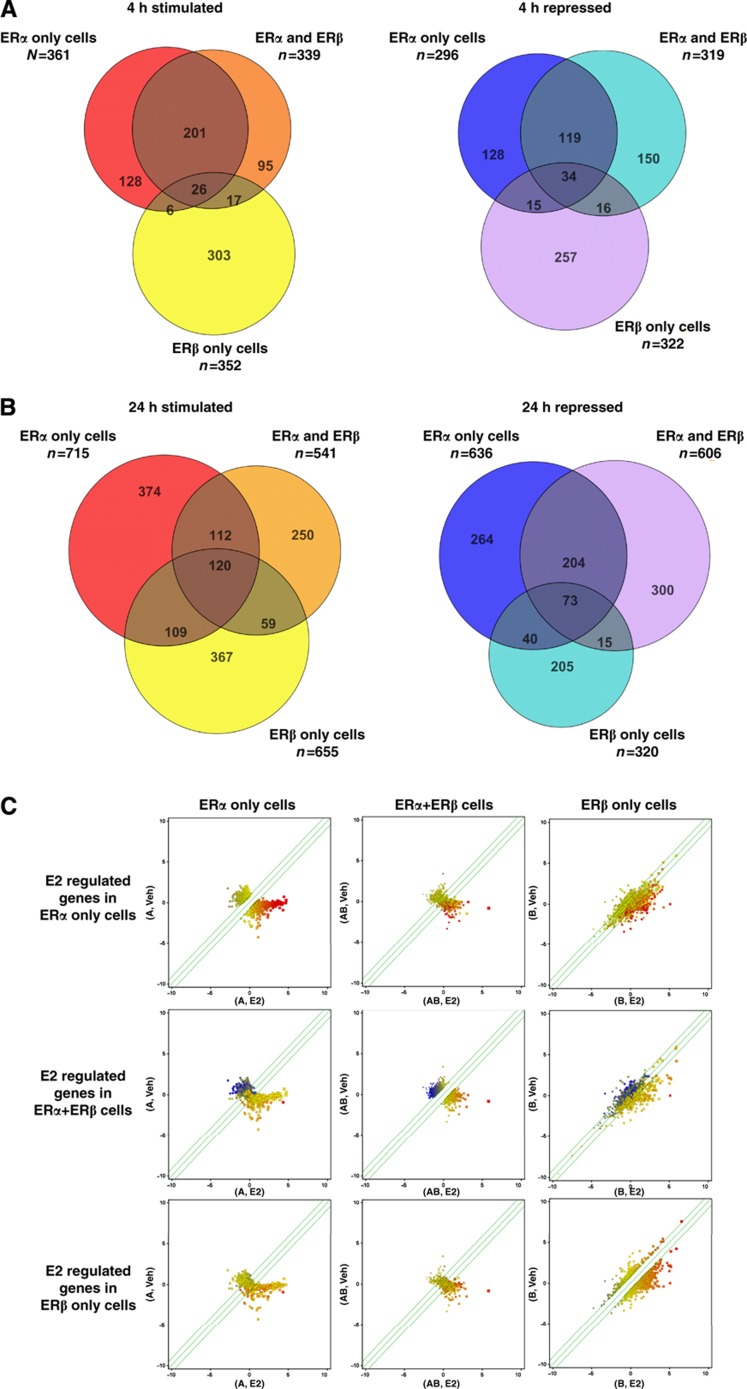
Patterns of E2-regulated gene expression in ERα, ERα/ERβ, and ERβ cells. (A) Comparison of number of 17β-estradiol (E2) regulated genes after 4 h of ligand treatment in different cell backgrounds. Genespring Venn Diagram tool was used to compare overlap between genes regulated ⩾1.8-fold with FDR of 0.01 in each background. (B) Comparison of number of E2-regulated genes after 24 h of ligand treatment in the different cell backgrounds. (C) Scatter plots for gene regulations in the different cell backgrounds: scatter plots of E2-regulated genes in each cell background were generated using the Genespring scatterplot tool. The top three panels show how genes that are regulated by E2 in ERα cells are also being regulated in ERα/ERβ cells and in ERβ cells. The middle three panels show how genes that are regulated by E2 in ERα/ERβ cells are also being regulated in ERα cells and in ERβ cells. The bottom three panels show how genes that are regulated by E2 in ERβ cells are also being regulated in ERα cells and in ERα/ERβ cells. E2-upregulated genes are shown in red and E2-downregulated genes are shown in blue.

