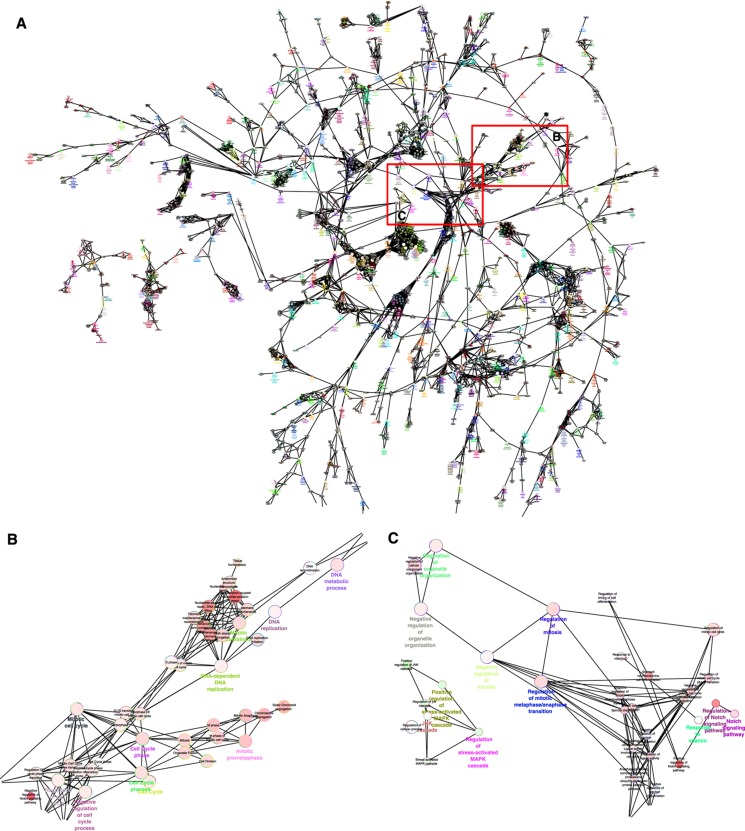
Figure 5.
Pathway analysis of the E2-regulated genes associated with the ERα and ERβ-binding site clusters. (A) Clustering of gene ontologies that are differentially enriched in ERα cells versus ERβ cells: ClueGO plugin of Cytoscape was used to identify differentially regulated GO terms between ERα and ERβ cells. (B) Expanded view of M-phase-associated clusters. (C) Expanded view of additional M-phase-associated clusters.

