Figure 3.
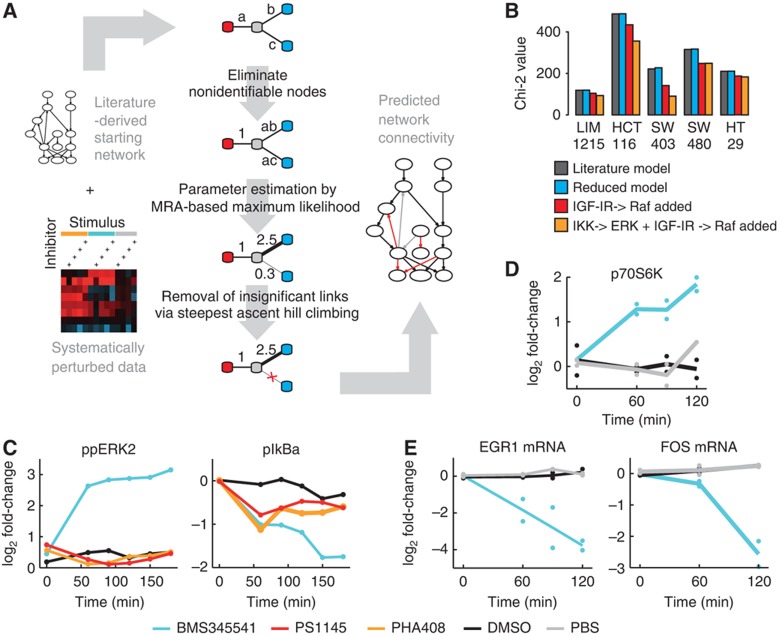
EGFR modeling required network alteration that led to the discovery of a new effect of BMS345541 on ERK. (A) Scheme of the modeling pipeline from the starting network to its parameterization. Systematic perturbation data and a starting network serve as input. The core-fitting routine consists of three steps, and is illustrated by a four-node example network. First, non-identifiable parameters are detected and reparameterized. Second, the identifiable parameter combinations are fitted to the experimental data. Third, connections not significantly contributing to the fit are removed and subsequently the remaining parameters are refitted. The resulting network contains information about the strength, direction and sign of its connections. (B) Chi-squared values of the models trained on data of five cell lines. Dark bars indicate values for the initial model. Blue, red and yellow bars show values after model reduction of literature network, with a link from IGFR to RAF, or when additionally including a link from IKK to ERK, respectively. (C, D) Log2 fold change in time-series experiments after treatment with IKK inhibitors or solvent controls to investigate the IKK–ERK relationship in HCT116 cells. (C) IKK inhibitor BMS345541 treatment results in an increased phospho-ERK level, whereas treatment with IKK inhibitors PHA408, PS1145 and solvent control (DMSO) results in no increase. The inhibition of IkBa phosphorylation is comparable for all three inhibitors after 1 h (Luminex, n=1). (D) Phosphorylation of p70S6K, a cytoplasmic target of ERK, increases after 60 min of BMS345541 treatment (western blot, n=2) when compared with DMSO and PBS control. (E) Expression of ERK target genes EGR1 and FOS decreases after BMS345541 treatment (qrt–PCR, n=2). Source data for this figure is available on the online supplementary information page.

