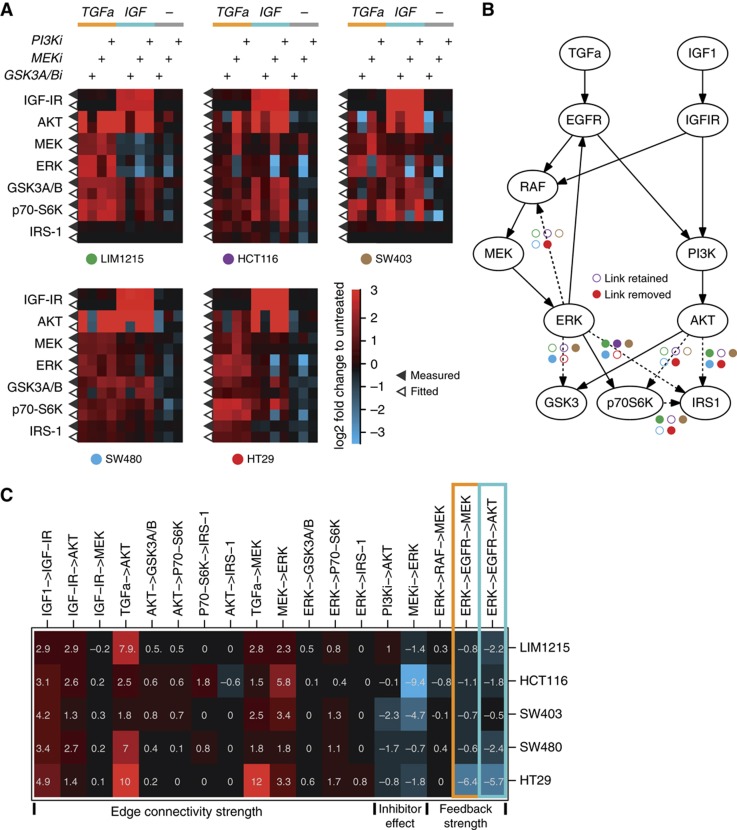
Figure 4.
Model fit uncoveres differences in network topology and signaling strength. (A) Heat maps for the five cell lines showing log2 fold changes of phosphorylation (filled triangles) and the corresponding model simulation (open triangles). (B) Network structure derived from the model fit. Dashed lines indicate edges that are removed in those cell lines marked by filled circles (same colors and layout as in A). (C) Model-deduced parameter values representing signaling strength for identifiable paths, inhibitors and feedback/cross talk expressed as log2 response coefficients. Orange and blue boxes indicate feedback from ERK via EGFR to MEK, and cross talk from ERK via EGFR to AKT.

