
Figure 5.
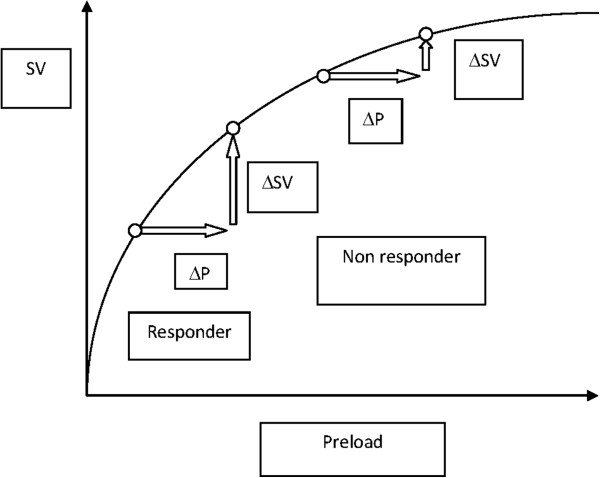
The Frank–Starling curve showing the relationship between diastolic myocardial tension (preload) and systolic cardiac function (stroke volume). An increase in preload results in a corresponding increase in stroke volume. Using the curve, it is possible to analyze who is a responder and who is a non-responder to fluid therapy. P: preload; SV: stroke volume.