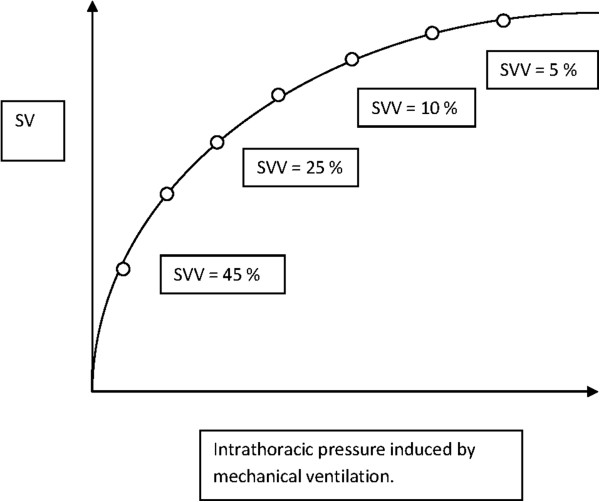
Figure 6.

The correlation between stroke volume variation (SVV) and the Frank–Starling curve. Round circles indicate changes in SVV as more fluid is given. When SVV is below 10% to 12%, the patient is said to be a non-responder. SV: stroke volume; SVV: stroke volume variation.
