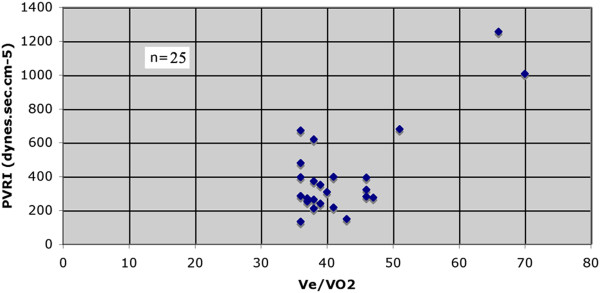
Figure 9.

Pulmonary vascular resistance vs./. All patients in this study had an AT of 10 ml.min−1.kg−1 or less. The graph shows the large variation in pulmonary vascular resistance with a / of greater than 35. To be certain that the pulmonary vascular resistance will exceed 35 kPa.L-1.s, the Ve / needs to be greater than 45. Note the PVRI of those patients with a / of 35. Data from the author’s laboratory.
