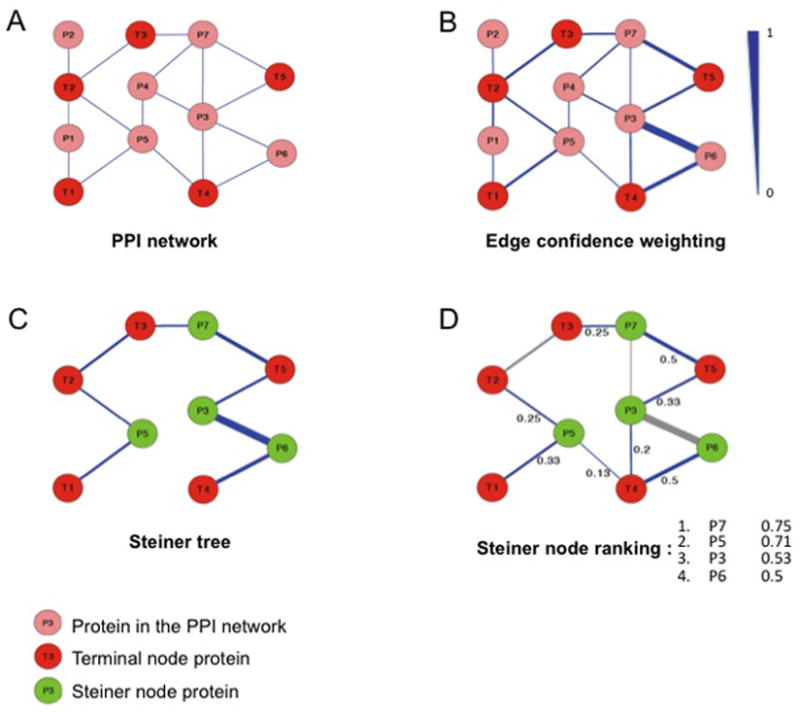
Figure 2. Steiner-tree approach.

A: Initial protein-protein interaction network including input proteins (terminal nodes marked in red). B: Edge confidence score, based on functional similarity (GO biological process) of connected proteins (scale: 0 to 1). C: Determination of the Steiner nodes (in green) connecting all input proteins with a minimal overall sum of edge costs. Edge cost is defined as the inverse of interaction confidence. D: Ranking of Steiner node proteins according to summed confidence scores of edges directly connecting them to terminal nodes.
