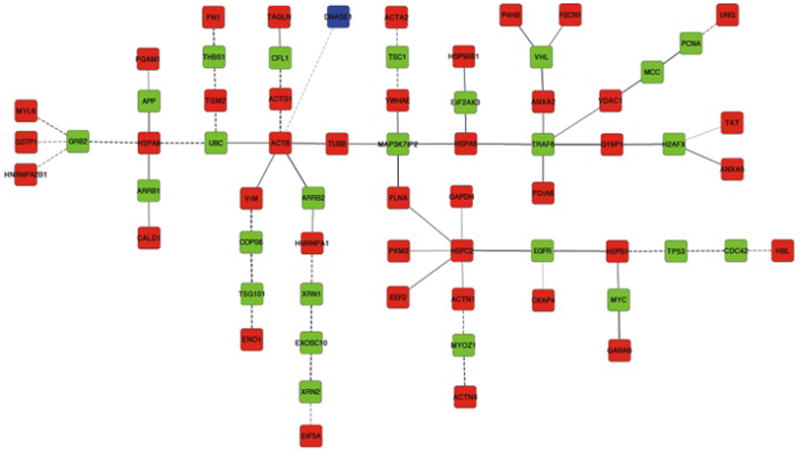
Figure 3. Computed Steiner tree.

Terminal nodes corresponding to human proteins are represented in red, DNase I in blue. Steiner node proteins are represented in green. Edge gray levels indicate confidence scores. Interactions tested in human samples are represented by solid lines and interactions tested only in other organisms are shown as dashed lines.
