Figure 5.

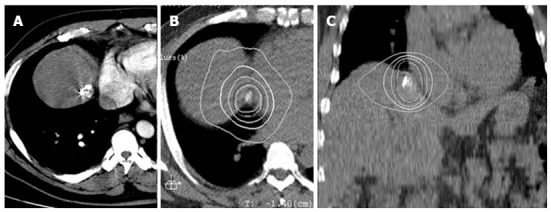
Case of hepatocellular carcinoma. Located adjacent to the right atrium (A). Axial and coronal view of radiation dose distribution (B and C). The isodose lines (white lines) from inner to outer represent 40, 30, 20, and 10 Gy, respectively.

Case of hepatocellular carcinoma. Located adjacent to the right atrium (A). Axial and coronal view of radiation dose distribution (B and C). The isodose lines (white lines) from inner to outer represent 40, 30, 20, and 10 Gy, respectively.