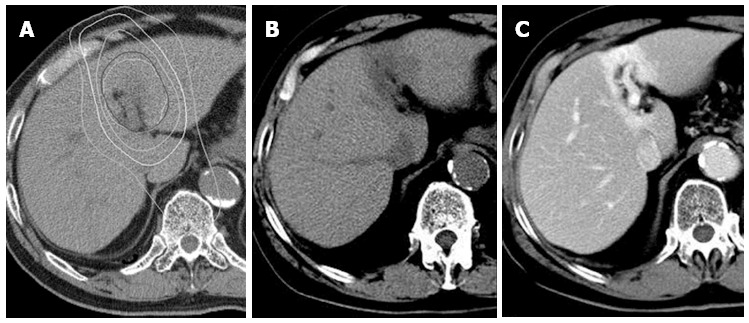
Figure 6.

Typical focal liver reaction 3 mo after stereotactic body radiation therapy seen on computed tomography. An axial view of radiation dose distribution (A). The isodose lines (white lines) from inner to outer represent 40, 30, 20, and 10 Gy, respectively. Pre-enhancement computed tomography shows a low-density lesion corresponding to a high-dose area (B). A well-demarcated enhancement due to contrast retention indicating congestion is seen in portal phase (C).
