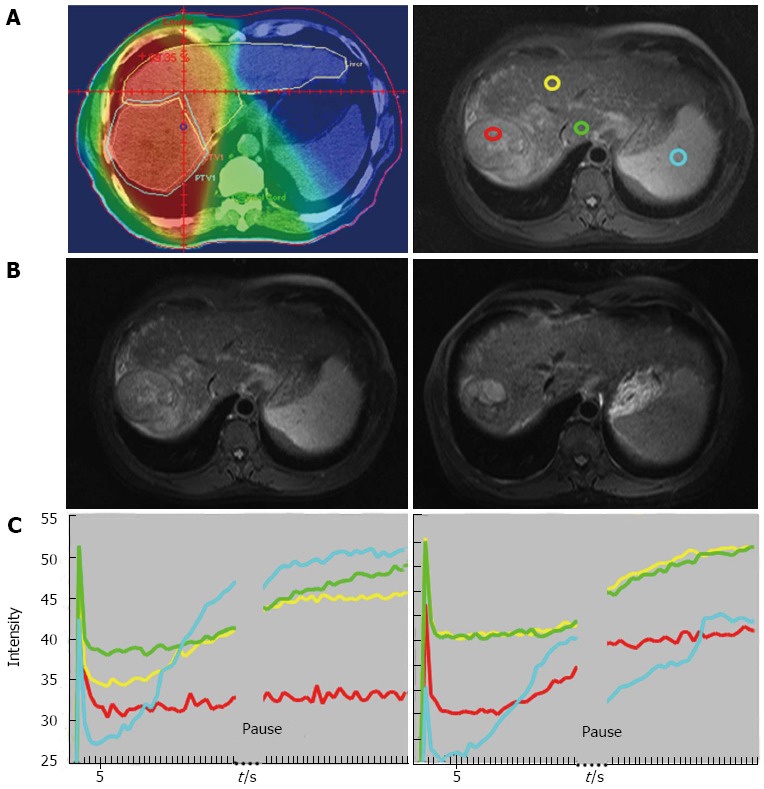
Figure 1.

Forty-nine-year-old man with good local response. A: Isodose distribution and region of interests (ROIs): Left panel: Isodose distribution on center section of radiation treatment planning. Red: 45 Gy; orange: 40 Gy; yellow: 30 Gy; green: 15 Gy and blue: < 15 Gy. Right panel: ROIs on MRI before RT: red: tumor with strongest enhancement; yellow: non-tumor liver parenchyma receiving 30 Gy; green: non-tumor liver parenchyma receiving 15 Gy; blue: spleen; B: T1 weighted contrast-enhanced MRI before RT (left panel, the site corresponding to the right panel of (A) and after RT (right panel). Arrows indicate tumor margins; C: Time Intensity Curve of ROIs before RT (left panel) and at week 2 of RT (right panel). Red: tumor; yellow: 30 Gy; green: 15 Gy; blue: spleen. The curve of spleen is deviated after pause for respiration due to interference by lung perfusion. The initial spike due to refocusing artifact will not be counted into analysis. (From reference [23], reprint with permission).
