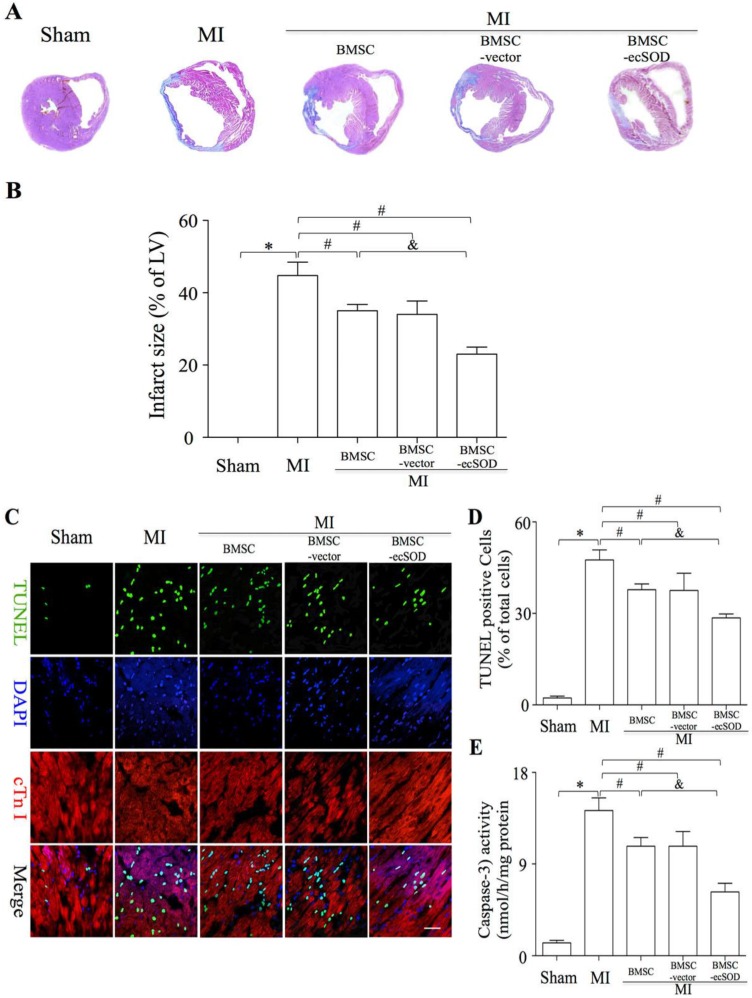
Figure 3.
Significant reduction of fibrosis and CMs apoptosis after BMSC-ecSOD transplantation. A: Representative images of Masson's trichrome staining of each group 4 weeks after MI; B: Quantitative analysis of Masson's trichrome staining; C: Representative images of immunostaining for apoptotic cells (green, TUNEL; blue, DAPI; scale bar, 100μm). D: quantification of apoptotic cells; E: Analysis of caspase-3 activity. *p < 0.05 vs. control group, #p< 0.05 vs. MI group, &p< 0.05 vs. BMSC group.

