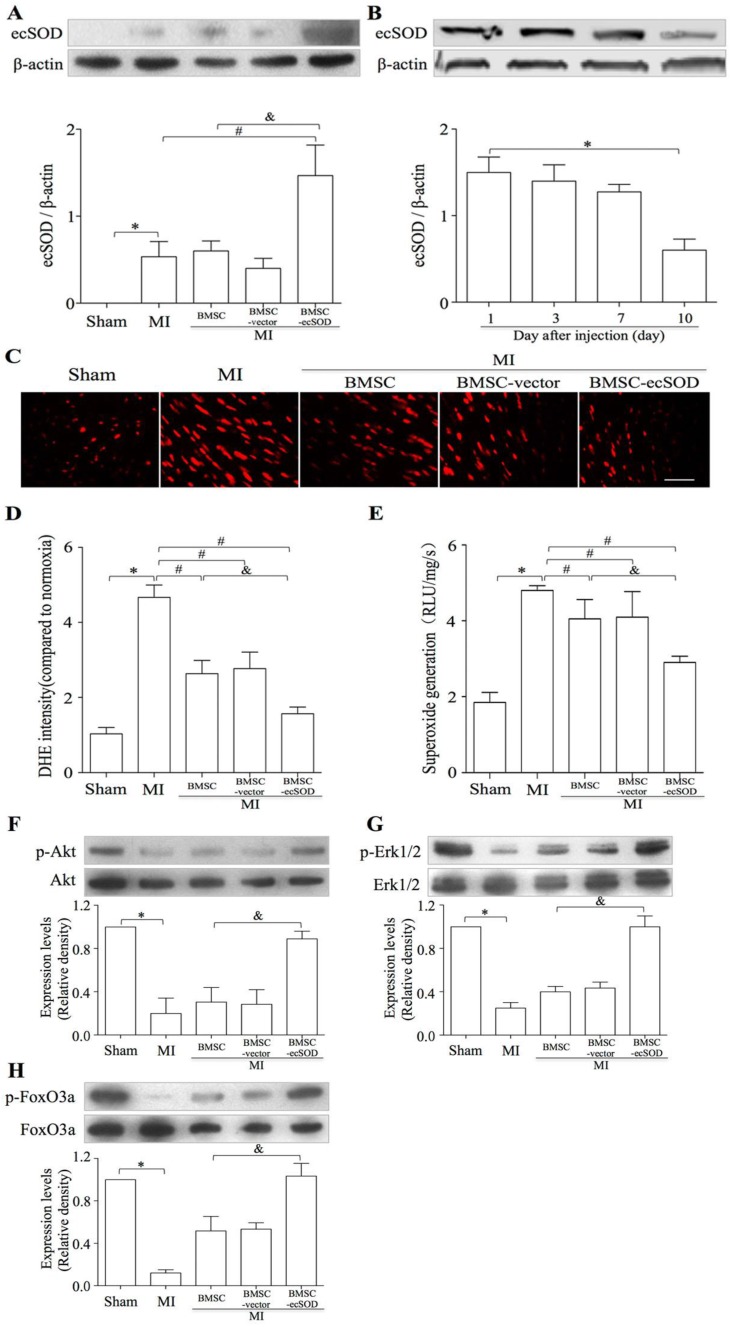
Figure 4.
A: The transplantation of BMSCs-ecSOD promoted the expression of ecSOD in myocardial tissues. B: The expression of ecSOD in BMSC-ecSOD group on 1, 3, 7 and 10 days after transplantation. C: Representative images of DHE staining. D: Quantification of DHE staining. E: Analysis of O2- production by lucigenin-enhanced chemiluminescence. F-G: Western blot and quantification of phosphorylation of Akt, Erk1/2 and FoxO3a. *p < 0.05 vs. control group; #p< 0.05 vs. MI group; &p< 0.05 vs. BMSC group.

