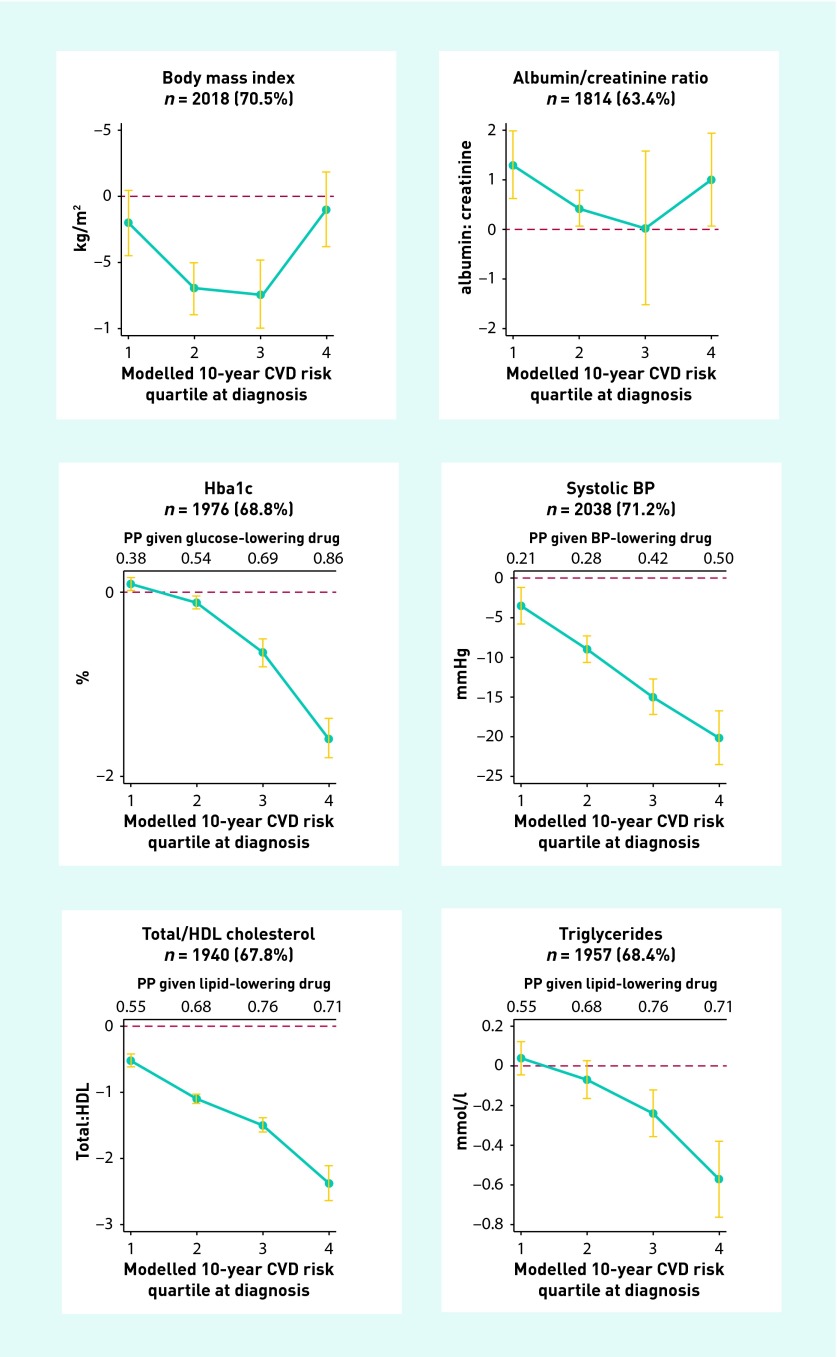
Figure 2.
Absolute change from diagnosis to 5 years (with 95% CI), by modelled CVD risk quartile at diagnosis, adjusted for age, ethnicity, age of leaving full-time education, sex, randomisation group, and practice and centre clustering. Q1, 0–24th centile; Q4, 75–100th centile. BP = blood pressure. PP = predicted probability of being prescribed the medication at 5 years (if not on the drug at baseline), in an adjusted model analogous to the primary analysis.

