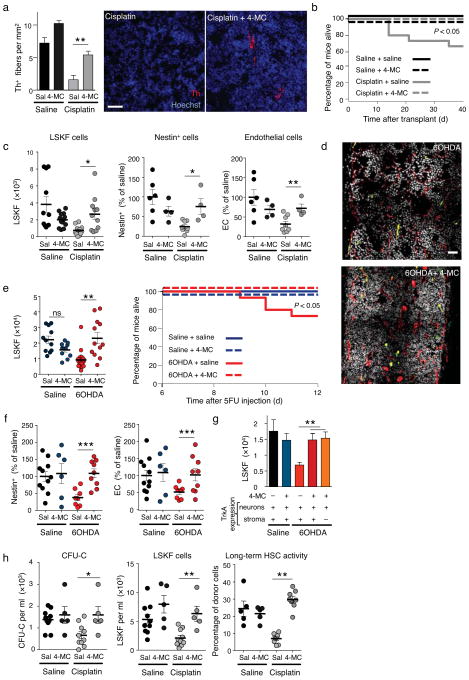
Figure 6.
Neuroprotection restores normal BM engraftment and mobilization. (a) Quantification of Th+ fibers in the BM of saline or cisplatin-treated mice after 4-MC neuroprotection, 4 weeks after the last cisplatin injection (n = 4–6). Representative immunofluorescence images showing Th+ fibers in the BM; red, Th; blue, DAPI. Scale bar, 40μm. (b) Overall survival of saline or cisplatin-treated mice after 4-MC neuroprotection and transplantation (n = 8–15). (c) The left panel shows the number of LSKF cells per femur in the BM of the mice analyzed in a (n = 11–13). Statistical comparisons were performed using the Mann Whitney method. The center and right panels show the percentage of Nestin-GFP+ or endothelial cells per femur in Nestin-Gfp mice treated with saline, cisplatin and 4-MC, 4 weeks after BM transplantation (n = 4). (d) Representative composite patchwork of femoral sections, 12 days after 5FU injection, of Nestin-gfp mice treated with saline, 6OHDA and 4-MC; red: CD31, white: DAPI, green: nestin-GFP+ cells. Scale bar, 100μm (e) Number of LSKF cells per femur in mice treated with saline, 6OHDA and 4-MC, 12 days after 5FU injection (n = 5–7). Statistical comparisons were performed using the Mann Whitney method; the right panel shows the overall survival of saline or 6OHDA-treated mice after 4-MC neuroprotection and 5FU injection (n = 8–29). (f) Percentage of nestin-GFP+ or endothelial cells per femur in Nestin-Gfp mice treated with saline, 6OHDA and 4-MC, 12 days after 5FU injection (n = 5–11). (g) Number of LSKF cells per femur in WT or Tα1-Cre:TrkANeo/Neo mice treated with 6OHDA and 4-MC, 12 days after 5FU injection (n = 3–8). (h) CFU-C and LSKF counts per ml of blood in saline (Sal) or cisplatin-treated mice after 4-MC neuroprotection and G-CSF mobilization; the right panel indicates the percentage of CD45.2+ cells in peripheral blood of CD45.1+ mice transplanted with 10μl of G-CSF mobilized blood and 2.5× 10⁵ competitor CD45.1+ BMNC.

