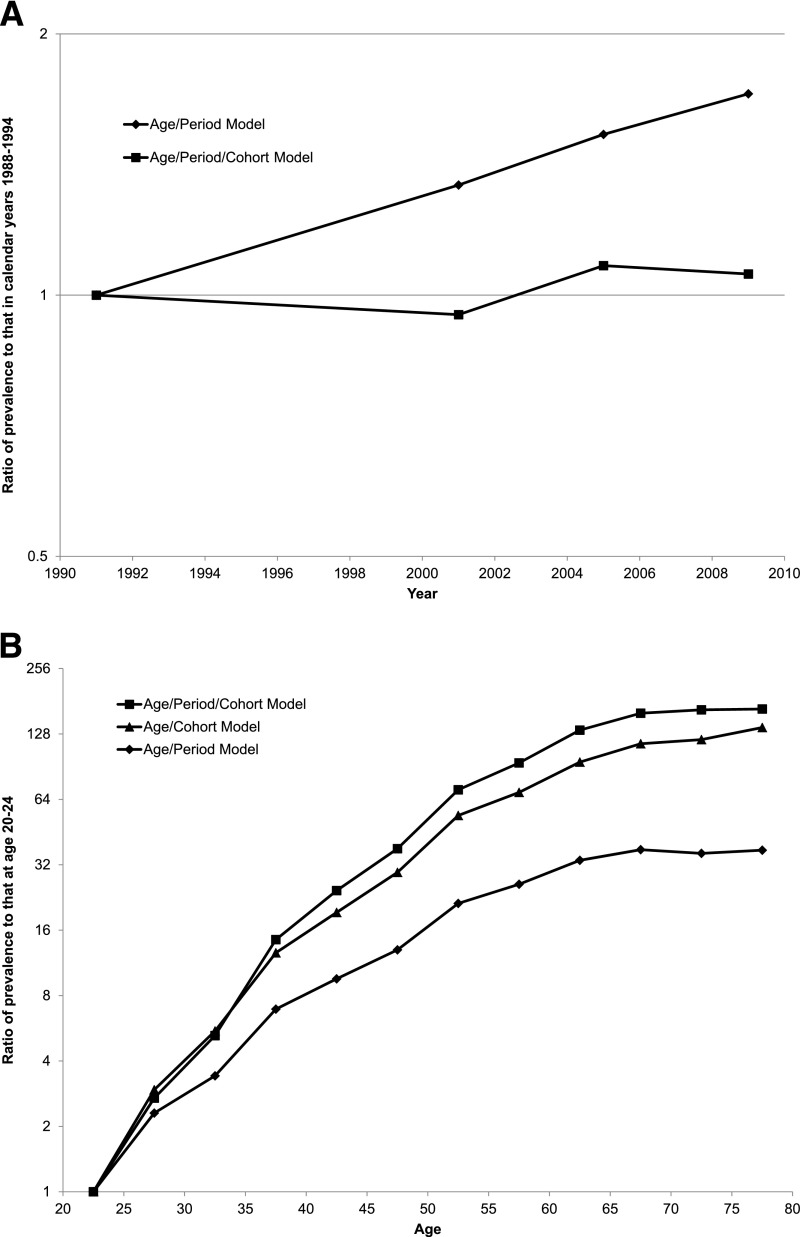
Figure 3.
Age-adjusted diabetes prevalence in periods relative to 1988–1994 (A); age-specific diabetes prevalence relative to age 20–24 years (B). A: Age-adjusted prevalence as a multiple of age-adjusted prevalence in the reference 1988–1994 period for the age/period model (diamonds) and age/period/cohort model (squares). B: Age-specific prevalence as a multiple of the prevalence at age 20–24 years in the age/cohort model (triangles), age/period model (diamonds), and age/period/cohort model (squares).

