Figure 5.
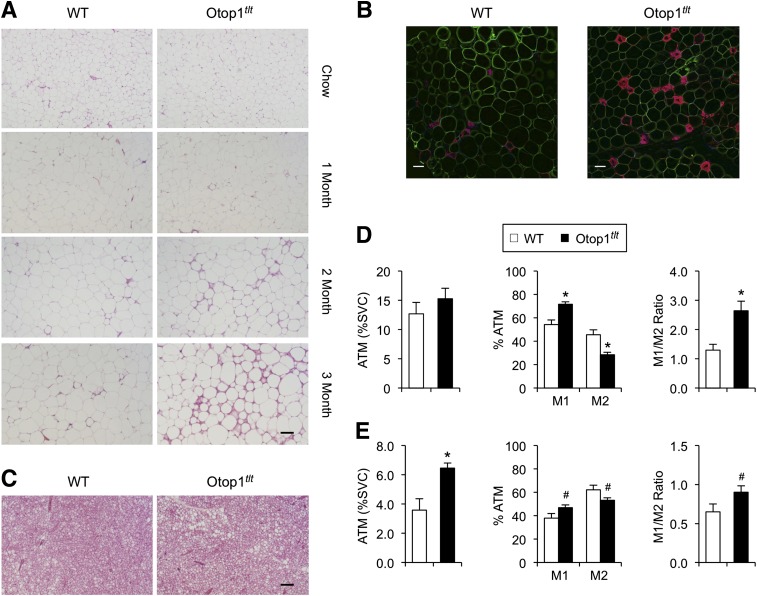
Otop1 mutant mice have exacerbated adipose tissue inflammation following HFD feeding. (A) H&E staining of eWAT from WT and Otop1tlt mice fed chow or HFD for different periods of time. Scale bar indicates 100 μm. (B) Confocal images of eWAT following whole-mount immunofluorescence staining using caveolin (green) and Mac2 (red) antibodies (scale bar = 50 μm). (C) H&E staining of BAT from WT and Otop1tlt mice fed with HFD for 3 months. (D) Flow cytometry analyses of adipose tissue macrophages in SVF of eWAT from HFD-fed WT (n = 8) and Otop1tlt (n = 7) mice. (E) Flow cytometry analyses of adipose tissue macrophage in iWAT from mice in D. Data in D and E represent mean ± SEM. **P < 0.05, #P < 0.1, Otop1tlt vs. WT. ATM, adipose tissue macrophage.

