Figure 6.
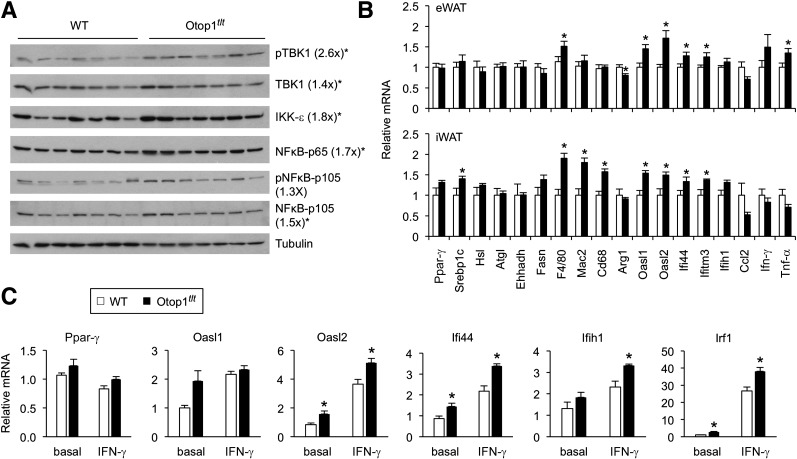
Otop1 negatively regulates WAT inflammation and IFN-γ response. (A) Immunoblots of inflammation markers in total eWAT lysates from HFD-fed mice. Fold change in Otop1tlt samples was quantitated following normalization to tubulin. *P < 0.05, Otop1tlt vs. WT. (B) qPCR analysis of eWAT and iWAT gene expression in HFD-fed WT (n = 8) and Otop1tlt (n = 8) mice for 3 months. Data represent mean ± SEM. *P < 0.05, Otop1tlt vs. WT. (C) qPCR analysis of epididymal fat explants from WT and Otop1tlt mutant mice without or with IFN-γ stimulation. Data represent mean ± SD from triplicate wells. *P < 0.05, Otop1tlt vs. WT.

