


Figure 2.
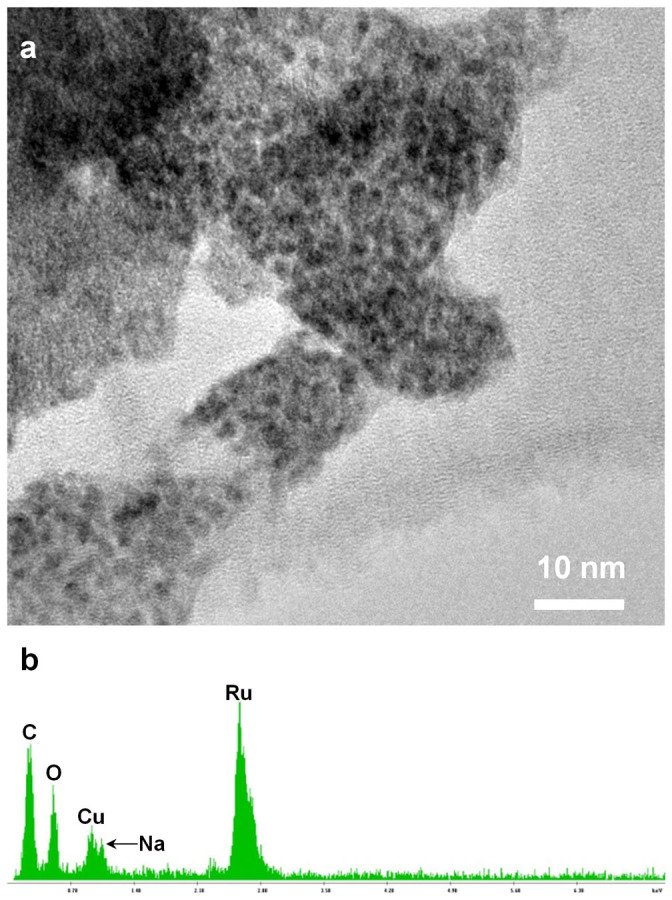
(a) HRTEM image of RuO2 nanoparticles. (b) EDS spectrum of the RuO2 nanoparticles showing the presence of the main components Ru, O along with minor amounts of sodium. Cu and C peak are background from the TEM support grid.
Official websites use .gov
A
.gov website belongs to an official
government organization in the United States.
Secure .gov websites use HTTPS
A lock (
) or https:// means you've safely
connected to the .gov website. Share sensitive
information only on official, secure websites.
(a) HRTEM image of RuO2 nanoparticles. (b) EDS spectrum of the RuO2 nanoparticles showing the presence of the main components Ru, O along with minor amounts of sodium. Cu and C peak are background from the TEM support grid.