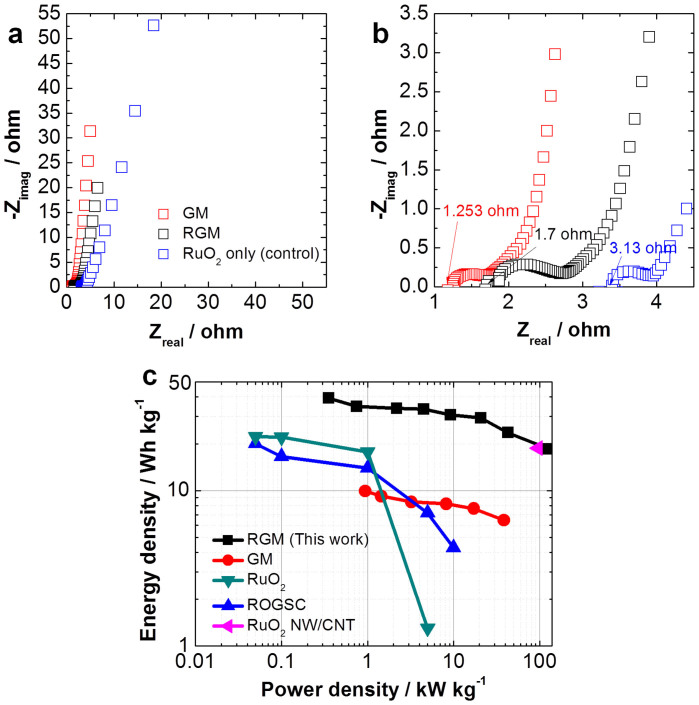
Figure 6.
(a) EIS plots and (b) high frequency region EIS plots of GM, RGM, a control sample (RuO2 nanoparticles only), respectively. (c) Ragone plot related to energy densities and power densities of the packaged whole cell RGM SC, GM SC7, RuO2 nanoparticles SC31, hydrous ruthenium oxide (RuO2)/graphene sheets composite (GOGSC)31, RuO2 nanowire/single walled carbon nanotube (SWNT) hybrid film73.

