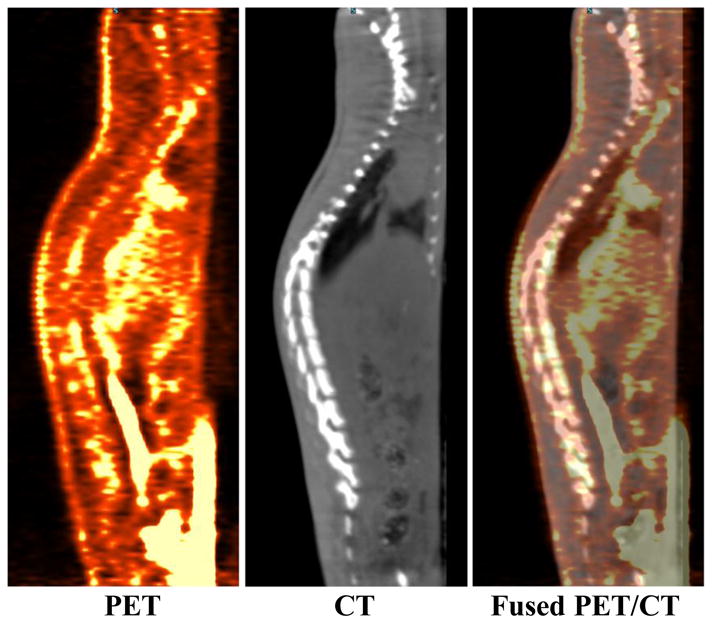
Figure 4.

PET (left), CT (middle) and fused PET/CT (right) sagittal images of Al18F-NODA-butyric acid with intensity scaled to allow imaging of organs with low levels of activity. The PET image, obtained by summing data from 5–60 min post-injection, demonstrates activity in the spine however this may consists of blood pool activity, marrow activity, activity in the bony matrix or a combination of the above.
