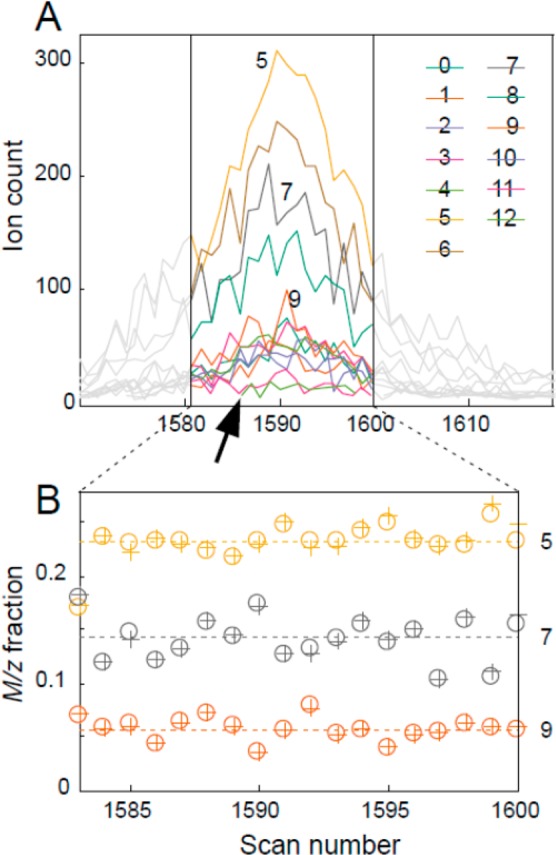
Figure 3.

Extracted ion chromatograms (EICs) of peptide VLFSR from 13C-labeled soybeans. (A) EICs are colored for scans within the full width at half-height of the total extracted isotopologue chromatogram, which was used for quantification. The EIC of mass trace 12 (monoisotopic m/z + 12/z) was only present in a subset of the scans (arrow). (B) Quantification of the EICs: 5, 7, and 9 are presented with scaling to the base m/z peak (+) or through nonlinear fitting (○). The dotted line indicates the mean fractional abundances.
