Abstract
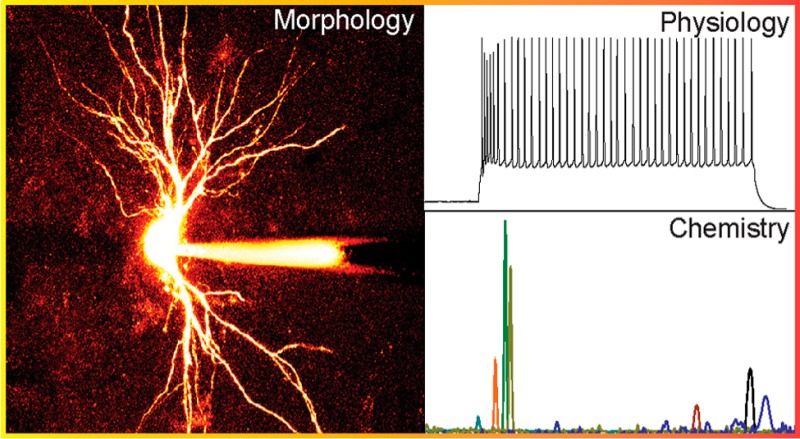
The visual selection of specific cells within an ex vivo brain slice, combined with whole-cell patch clamp recording and capillary electrophoresis (CE)–mass spectrometry (MS)-based metabolomics, yields high chemical information on the selected cells. By providing access to a cell’s intracellular environment, the whole-cell patch clamp technique allows one to record the cell’s physiological activity. A patch clamp pipet is used to withdraw ∼3 pL of cytoplasm for metabolomic analysis using CE–MS. Sampling the cytoplasm, rather than an intact isolated neuron, ensures that the sample arises from the cell of interest and that structures such as presynaptic terminals from surrounding, nontargeted neurons are not sampled. We sampled the rat thalamus, a well-defined system containing gamma-aminobutyric acid (GABA)-ergic and glutamatergic neurons. The approach was validated by recording and sampling from glutamatergic thalamocortical neurons, which receive major synaptic input from GABAergic thalamic reticular nucleus neurons, as well as neurons and astrocytes from the ventral basal nucleus and the dorsal lateral geniculate nucleus. From the analysis of the cytoplasm of glutamatergic cells, approximately 60 metabolites were detected, none of which corresponded to the compound GABA. However, GABA was successfully detected when sampling the cytoplasm of GABAergic neurons, demonstrating the exclusive nature of our cytoplasmic sampling approach. The combination of whole-cell patch clamp with single cell cytoplasm metabolomics provides the ability to link the physiological activity of neurons and astrocytes with their neurochemical state. The observed differences in the metabolome of these neurons underscore the striking cell to cell heterogeneity in the brain.
Capillary electrophoresis (CE) offers the ability to separate a wide range of biomolecules from a variety of samples with outstanding success, including volume-limited samples such as individual organelles and single cells.1−5 One benefit of the capacity to interrogate small volumes is the ability to characterize the cell to cell differences from a heterogeneous cell population.6,7 As we show here, the sensitivity of CE when hyphenated to mass spectrometry (MS) enables the detection of a range of metabolites from single mammalian neurons.
CE has been combined with patch clamp recording as a form of sampling to introduce specific compounds to the patched cell.8−13 In these prior studies, the ion channel agonists were separated by CE with the capillary outlet positioned to release the compounds over a patch-clamped cell to detect physiological responses. The current work appears to be the first report of a metabolomic analysis of specific cells from a brain slice using patch clamp as a sampling method. More specifically, we used the patch clamp to sample from the cytoplasm and perform a small-volume assay using CE–MS.
Of the “omics” approaches, single cell transcriptomics has routinely been combined with electrophysiological sampling,14−18 whereas single cell metabolomics measurements are less common. Even though single cell and subcellular sampling with direct MS has been used, more complete metabolomics coverage is obtained by incorporating a separation step before performing the mass spectrometric analysis.19−23 We have developed a range of single cell metabolomics approaches using CE–MS.24−27 While most of these prior studies have been with larger invertebrate neurons, CE–MS is adaptable to a wide range of smaller cell types. For many models and cell types, it can be difficult to select specific cells. Here we use a visualized whole-cell patch clamp approach to select specific cells, characterize their physiological properties, and sample a small volume of an individual cell’s cytoplasm for subsequent analysis with CE–MS. This approach offers unmatched information on cell function and neurochemical content.
Experimental Section
Thalamic Slice Preparation
Experimental procedures were carried out in accordance with the National Institutes of Health Guidelines for the Care and Use of Laboratory Animals and approved by the University of Illinois Animal Care and Use Committee. Thalamic slices were prepared from Sprague–Dawley rats (Harlan Laboratories, Inc., Indianapolis, IN) of either sex (postnatal age, 14–17 days) as previously described.28−30 Rats were deeply anesthetized with sodium pentobarbital (50 mg/kg) and decapitated. Brains were quickly removed and immediately transferred into a cold (4 °C), oxygenated (95% O2, 5% CO2) slicing solution containing (in mM): 2.5 KCl, 26 NaHCO3, 1.25 NaH2PO4, 10.0 MgCl2, 2.0 CaCl2, 234.0 sucrose, and 11.0 glucose. Using a vibrating tissue slicer, thalamic slices (275–300-μm thick) were cut on a horizontal plane to access the thalamic reticular nucleus (TRN) and ventral basal (VB) nucleus and on the coronal plane for the dorsal lateral geniculate nucleus (dLGN); astrocyte samples were prepared from slices taken from both planes. Tissue slices were transferred into a holding chamber containing oxygenated (95% O2, 5% CO2) artificial cerebrospinal fluid (aCSF), which consisted of (in mM): 126.0 NaCl, 26.0 NaHCO3, 2.5 KCl, 1.25 NaH2PO4, 2.0 MgCl2, 2.0 CaCl2, and 10.0 glucose. The tissue was incubated at 32 °C for approximately 20 min and then cooled to 21 °C.
Whole Cell Recording Procedures
Individual slices were transferred to a recording chamber (∼1.5 mL volume) that was maintained at 32 °C with oxygenated aCSF and recirculated at 2.5–3 mL/min. Individual neurons were visualized using a fixed-stage microscope (Olympus BX-51WI; Olympus America Inc., Center Valley, PA) equipped with Dodt contrast optics (Prairie Technologies, Middleton, WI) and a water-immersion objective (60× ; LUMPlan FL N, FN26.5, Olympus). The patch pipets had a tip resistance of 3–6 MΩ (∼2 μm-diameter tip) when filled with the following solution (in mM): 117.0 K-gluconate, 13.0 KCl, 1.0 MgCl2, 0.07 CaCl2, 0.1 EGTA, 10.0 HEPES, 2.0 Na2-ATP, and 0.4 Na-GTP (pH 7.3, 290 mOsm). Initial experiments used an intracellular solution containing (in mM): 117.0 potassium gluconate, 13.0 KCl, 1.0 MgCl2, 0.07 CaCl2, 0.5 EGTA, 10.0 HEPES, 2.0 Na2-ATP, 0.4 Na-GTP, and 5.0 phosphocreatine, but it was found that the phosphocreatine was abundant enough to produce ionization suppression effects for the remainder of the CE–MS run and so was not used in later experiments.
In a subpopulation of recordings, Alexa Fluor 594 fluorescent dye (50 μM) (Life Technologies, Grand Island, NY) was included in the recording pipet to allow for more detailed morphological identification of the recorded cell using fluorescence microscopy. The pipet solution resulted in a junction potential of 10 mV and was corrected for all voltage recordings. During recording, the pipet capacitance was neutralized and the access resistance continually monitored. The electrophysiology data was acquired using an Axon MultiClamp 700A amplifier (Molecular Devices, Inc., Sunnyvale, CA), filtered at 2–3 kHz, and digitized at 10 kHz using an Axon Digidata 1440A digitizer, in combination with pCLAMP 10 software. Images of fluorescent labeled neurons were collected as a z-stack using two-photon laser scanning miscroscopy (Prairie Technologies/Bruker, Middleton, WI).
Collecting Intracellular Material
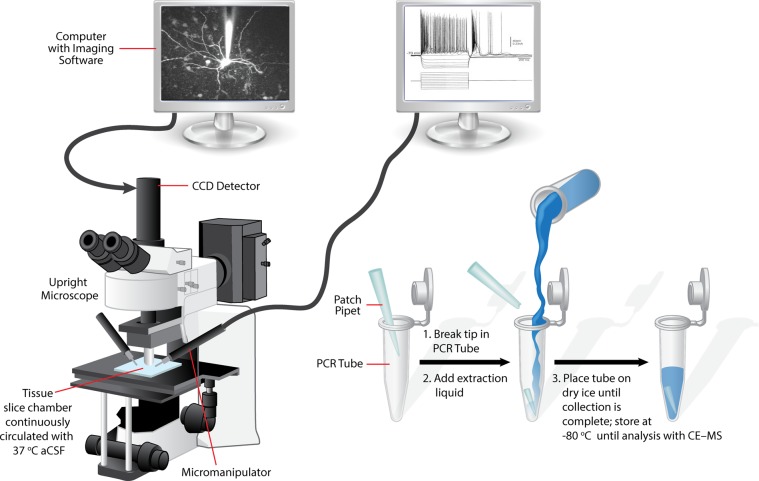
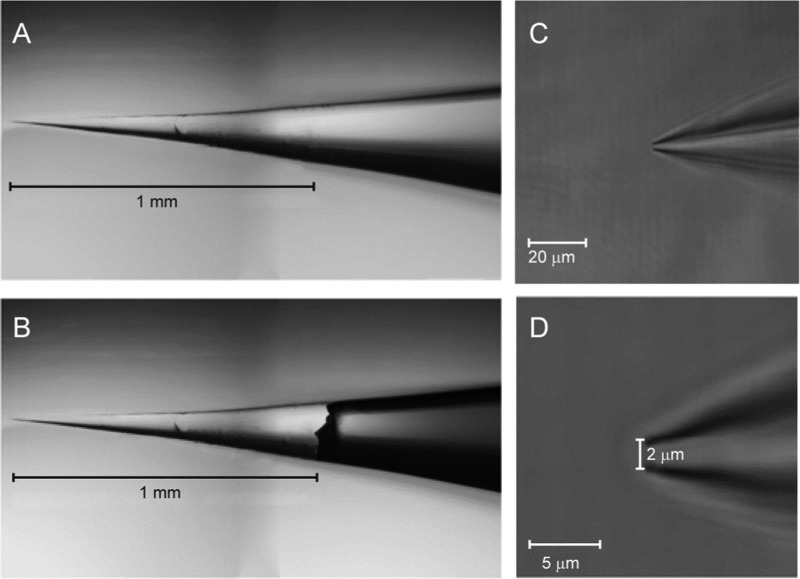
Once whole cell configuration was established, a series of current steps were applied (−200 to 200 pA, 40 pA steps, 800 ms duration) to characterize the intrinsic membrane properties of the cell, such as resting membrane potential, apparent input resistance, and action potential characteristics. Intracellular contents were removed from the recorded neuron by applying negative pressure, via mouth pipetting or a manometer, to the recording pipet while simultaneously recording the neuron’s physiology and visualizing the cell using Dodt contrast (Figure 1). Only cells whose seals were held tightly (>1 GΩ) and membranes were not ruptured were collected for analysis as cytoplasm samples, ensuring that only intracellular material was collected and analyzed. If the membrane ruptured during the application of negative pressure, the samples were sometimes analyzed as control samples as they contained extracellular contamination. Once a sufficient amount of material was withdrawn from the cell, the patch pipet was quickly removed from the slice and ∼1 mm of the distal tip broken off (Figure 2) against the bottom of a 0.2 mL thin-walled PCR tube (USA Scientific, Inc., Ocala, CA). A metabolite extraction solution (250 nL) composed of 50% methanol and 0.5% acetic acid (v/v) was then added to the tube. Sample tubes were placed on dry ice until sample collection was completed for the day and then stored at −80 °C until analysis with CE–MS. The volume of cytoplasm withdrawn was estimated by taking images of the Alexafluor-injected neuron before and after applying negative pressure to the patch pipet and then using ImageJ to measure the length and width of the cell body and calculating the volume of the cell (assuming an ellipsoid) before and after withdrawing the cytoplasm. The difference in volumes was the amount withdrawn into the pipet.
Figure 1.
Schema illustrating the workflow for sample collection. An upright microscope is used for conducting electrophysiology experiments under video observation. Following the process of establishing the whole-cell configuration as described in the text, negative pressure is applied to the patch pipet and the cytoplasm is withdrawn. The patch pipet is removed and the tip broken off into the bottom of a PCR tube. Extraction solution is then added to the tube and the sample centrifuged and placed on dry ice until analysis by CE–MS.
Figure 2.
Images of a patch pipet tip used for collection. (A) Photomicrographs of the intact tip of the patch pipet. (B) An overlay of the pipet tip after being broken off into the PCR tube. (C) Close-up image of the patch pipet tip. (D) Close-up image of the patch pipet tip showing the tip diameter.
CE–MS
CE–MS was performed as reported previously31 using either a micrOTOF or a maXis 4G Qq-ToF mass spectrometer (Bruker Daltonics, Billerica, MA) operated in positive ion mode. The current procedure differed from our prior work in that we used a capillary length of 65–70 cm, a separation potential of 14–16 kV, and a sample injection volume of ∼28 nL. Over 100 distinct molecular features were detected from the cytoplasm samples, among which 70 metabolite identities were assigned with high confidence through spiking with standards, migration order agreement, and matching of tandem mass spectral data from the endogenous substances with those of chemical standards when available and with fragmentation profiles found at publicly available mass spectral databases (Metlin32 and HMDB33). A signal-to-noise ratio of 3 was used as the threshold of detection for an analyte while using an isolation width of ±10 mDa; the migration time also had to match the standard within the typical variation in migration times for other compounds within each CE run.
Results and Discussion
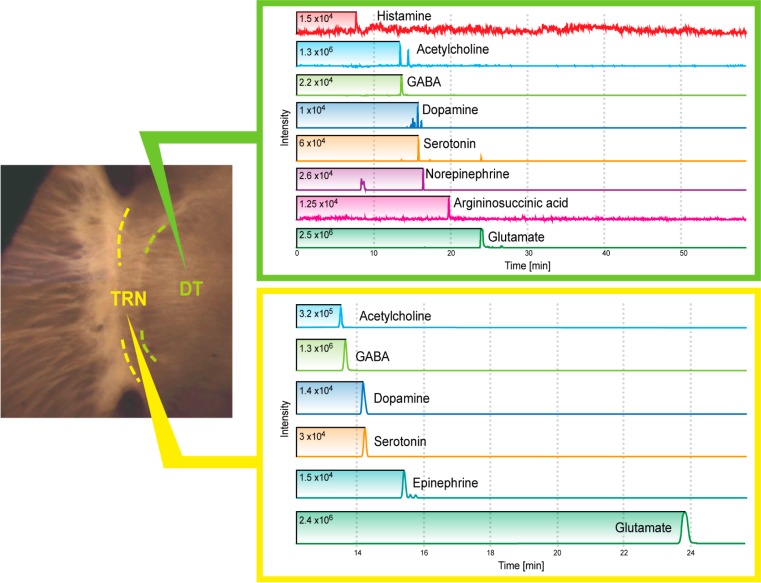
Sample selection is especially important for this work as we are validating a new measurement platform and so we need information on the expected transmitters and details on cellular heterogeneity. The thalamus, a centrally located brain structure that provides a major extrinsic input to the neocortex,34 has been shown to play a central role in behavioral state transitions (e.g., the sleep/wake cycle), sensory processing, and certain types of epilepsy.35,36 Like many brain areas, the thalamus contains populations of both excitatory glutamatergic neurons (located in the dorsal thalamus) as well as inhibitory GABAergic neurons (the major cell type in the TRN).34,37 Before moving to single cell samples, we examined larger samples of adjacent thalamic nuclei from a 280-μm-thick section (Figure 3), which were microdissected, placed in 2.5 μL of the extraction solution, and analyzed by CE–MS. Even adjacent nuclei showed striking differences in the abundance and presence of different neurotransmitters. The heterogeneity observed in two distinct thalamic nuclei, which have been shown to only use the neurotransmitters GABA and glutamate, prompted us to determine the more precise localization of the cell to cell signaling within these areas.
Figure 3.
Microdissected thalamic nuclei from adjacent regions of a 280-μm-thick section produce dramatically different neurotransmitter profiles when analyzed by CE–MS. The thalamic reticular nucleus (TRN) contains purely GABAergic neurons, but the slice provides sufficient amounts of acetylcholine and glutamate in addition to GABA for MS detection. The dorsal thalamus (DT) contains predominantly glutamatergic neurons (such as those of the dorsal lateral geniculate nucleus, which were patched in this study) but the slice contains abundant amounts of histamine, acetylcholine, GABA, serotonin, norepinephrine, as well as the nitric oxide precursor, argininosuccinate. Additional metabolites from these slices are listed in Table S2 in the Supporting Information.
As illustrated in Figure 1, when working with individual cells rather than brain sections, the workflow involved standard whole-cell patch clamp electrophysiology recordings, where a selected cell was patched.28−30 Within a specific region of the thalamic slice, a cell was carefully approached while applying positive pressure. When the glass pipet tip (Figure 2) was in contact with the cell membrane, negative pressure was applied to form a tight GΩ seal. Whole-cell configuration was established by applying additional negative pressure to puncture a passageway into the cell membrane. In order to characterize the intrinsic properties from the sampled cell, the current protocol described above was applied. Once a stable patch was confirmed (after 2–30 min when dye injection was used for imaging), the intracellular material was collected by applying additional negative pressure after the electrical recordings to withdraw a small volume of the cell contents into the pipet. A small section of the pipet was then broken off into the sample vial (Figure 1) and later measured with CE–MS.
The cytoplasm of individual neurons contained varying amounts of metabolites, several of which were detected in a cell-type specific manner (e.g., GABA, histamine). Samples for control experiments were produced by (1) breaking the patch pipet tip into PCR tubes following filling of the pipet with intracellular recording solution; (2) penetrating the tissue and approaching the cell without patching; (3) penetrating the tissue and approaching the cell and applying negative pressure to draw extracellular fluid into the patch pipet; and (4) patching a cell and performing a current injection and pulling the pipet off of the cell, taking care not to apply negative pressure before pulling the pipet off. In these control experiments, we detected several low signals corresponding to amino acids, even without patching onto a cell (from the extracellular media). One of our primary focuses was on the transmitter GABA; none was detected from the control samples or from the cytoplasm of glutamatergic neurons.
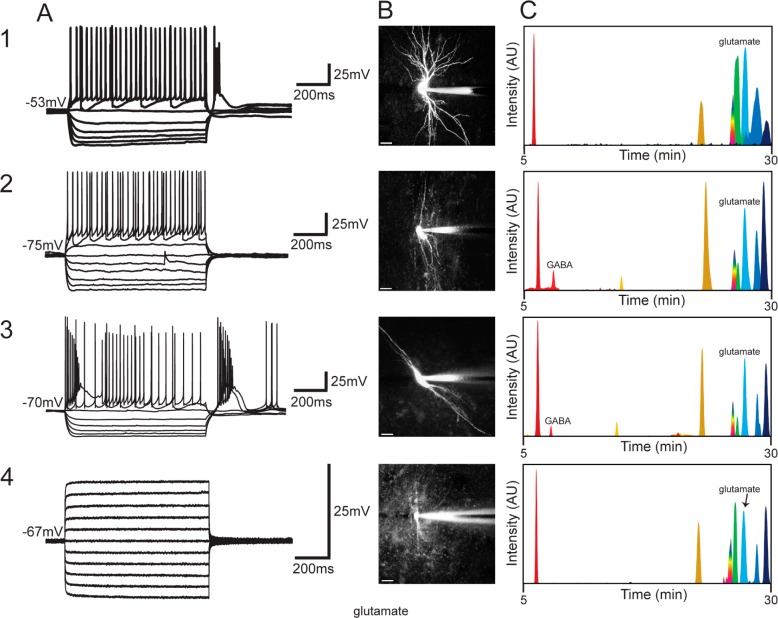
Figure 4 shows representative electrophysiological traces (column A), photomicrographs (column B), and the corresponding ion electropherograms for three different neurons as well as an astrocyte (column C). Table S1 in the Supporting Information compares the number of detected metabolites from microdissected nuclei versus cytoplasm across the different cell types analyzed in these experiments. The neurotransmitter GABA (light red peak in Figure 4C2,C3) was detected in cytoplasm from two electrophysiologically distinct types of TRN neurons (the burst firing and the nonburst firing); overall, it was detected in 11 of 14 of the TRN neurons, one of four astrocyte samples, and the single dLGN interneuron sampled. It was never detected in VB neurons (n = 5) or in dLGN relay neurons (n = 6) (Figure 4C1). Further studies are needed to determine if there is a distinct population of GABA-negative cells in the TRN. Glutamate (light blue peak in Figure 4C) was detected in 28 of 30 samples (the two samples in which glutamate was not detected had issues during CE separation and so the separation was stopped before glutamate would have been detected).
Figure 4.
Data obtained from four distinct cell types: (1) VB thalamocortical neuron; (2) nonburst firing TRN neuron; (3) bursting TRN neuron; (4) astrocyte. (A) Electrophysiological recordings of the individual cells (1–4) shown in the (B) photomicrographs (scale bar = 20 μm). (C) Extracted ion chromatograms corresponding to the cytoplasm sampled from the neurons and glia are shown. Peaks correspond to ornithine (dark red), GABA (light red), glycine (yellow), serine (gold), tryptophan (rainbow), glutamine (light green), glutamate (light blue), tyrosine (dark blue), and proline (indigo).
The whole-cell patch-clamp technique has long been used to assay the electrophysiology of individual neurons in acute in vitro thalamic slice preparations. Here we take advantage of the patch pipet to withdraw picoliter volumes of cytoplasm from the identified neurons to explore their metabolome. Across all cell types, amino acids such as ornithine (dark red peak, Figure 4C), arginine, glutamate (light blue peak, Figure 4C), tyrosine (dark blue peak, Figure 4C), phenylalanine, histidine, serine (gold peak, Figure 4C), and proline (indigo peak, Figure 4C) were detected in >50% of all cells. Other molecules such as the polyamines spermine and spermidine, adenine, glutathione, and nucleotides such as adenosine were also frequently detected (30–80%). Some metabolites, such as the amino acids asparagine and citrulline (related to NO production via nitric oxide synthase), and the neurotransmitters histamine and GABA (light red peak Figure 4C), were detected in less than half of the cells or only in specific cell types such as TRN neurons and dLGN interneurons. Table S2 in the Supporting Information lists all of the identified metabolites and their frequency of detection across all cell types.
In our previous CE–MS measurements24,31 and MALDI MS measurements21,38,39 from individual cells, we detected multiple cellular metabolites; however, these studies characterized all compounds in the isolated samples, including the compounds present in an isolated cell and also those present in structures that remained attached to the cell, such as nerve and glia terminals from other cells. Although the volume of these attached structures may be small, some metabolites such as transmitters may be present in high concentrations and, thus, will be detected. Our patch clamp sampling should minimize such confounding factors as we are sampling the internal cytoplasm of the selected cell. In our prior work (as well as in many unpublished measurements), GABA was detected in samples of individual invertebrate neurons,25 which were not expected to be GABAergic based on an earlier report using immunohistochemistry.40 Here our results agree with prior immunocytochemistry localization determined using the enzyme glutamic acid decarboxylase37 as well as GABA-like immunoreactivity in the TRN,41 validating the fidelity of our sampling approach.
In summary, the ability to combine patch clamp electrophysiology with CE–MS offers a potential new measurement tool for characterizing cell to cell heterogeneity in well-defined cell samples. The approach is well suited for examining cell types other than neurons, such as astrocytes,42 and provides quantitative information relating neuronal activity to changes in the cellular metabolome within a physiologically relevant context.
Acknowledgments
This work was supported by Award Numbers P30 DA018310 from the National Institute on Drug Abuse, R01 MH085324 and R21 MH100704 from the National Institutes of Mental Health, and R01 EY014024 from the National Eye Institute. The assistance of Dr. Stanislav Rubakhin in several initial experiments is gratefully acknowledged. The content is solely the responsibility of the authors and does not necessarily represent the official views of the awarding agencies.
Supporting Information Available
Supporting tables (Tables S1 and S2) as noted in the text. This material is available free of charge via the Internet at http://pubs.acs.org.
Author Present Address
⊗ K.R.L. and C.L.C.: Department of Physiology, Michigan State University, East Lansing, MI 48824.
The authors declare no competing financial interest.
Funding Statement
National Institutes of Health, United States
Supplementary Material
References
- Johnson R.; Navratil M.; Poe B.; Xiong G.; Olson K.; Ahmadzadeh H.; Andreyev D.; Duffy C.; Arriaga E. Anal. Bioanal. Chem. 2007, 387, 107–118. [DOI] [PubMed] [Google Scholar]
- Chiu D. T.; Lillard S. J.; Scheller R. H.; Zare R. N.; Rodriguez-Cruz S. E.; Williams E. R.; Orwar O.; Sandberg M.; Lundqvist J. A. Science 1998, 279, 1190–1193. [DOI] [PubMed] [Google Scholar]
- Ramautar R.; Somsen G. W.; de Jong G. J. Electrophoresis 2013, 34, 86–98. [DOI] [PubMed] [Google Scholar]
- Kennedy R. T.; Oates M. D.; Cooper B. R.; Nickerson B.; Jorgenson J. W. Science 1989, 246, 57–63. [DOI] [PubMed] [Google Scholar]
- Trouillon R.; Passarelli M. K.; Wang J.; Kurczy M. E.; Ewing A. G. Anal. Chem. 2012, 85, 522–542. [DOI] [PubMed] [Google Scholar]
- Rubakhin S. S.; Romanova E. V.; Nemes P.; Sweedler J. V. Nat. Methods 2011, 8, S20–S29. [DOI] [PMC free article] [PubMed] [Google Scholar]
- Lapainis T.; Sweedler J. V. J. Chromatogr. 2008, 1184, 144–158. [DOI] [PubMed] [Google Scholar]
- Jardemark K.; Farre C.; Jacobson I.; Zare R. N.; Orwar O. Anal. Chem. 1998, 70, 2468–2474. [DOI] [PubMed] [Google Scholar]
- Farre C.; Sjoberg A.; Jardemark K.; Jacobson I.; Orwar O. Anal. Chem. 2001, 73, 1228–1233. [DOI] [PubMed] [Google Scholar]
- Fishman H. A.; Orwar O.; Scheller R. H.; Zare R. N. Proc. Natl. Acad. Sci. U.S.A. 1995, 92, 7877–7881. [DOI] [PMC free article] [PubMed] [Google Scholar]
- Jardemark K.; Orwar O.; Jacobson I.; Moscho A.; Zare R. N. Anal. Chem. 1997, 69, 3427–3434. [DOI] [PubMed] [Google Scholar]
- Orwar O.; Jardemark K.; Jacobson I.; Moscho A.; Fishman H. A.; Scheller R. H.; Zare R. N. Science 1996, 272, 1779–1782. [DOI] [PubMed] [Google Scholar]
- Shear J.; Fishman H.; Allbritton N.; Garigan D.; Zare R.; Scheller R. Science 1995, 267, 74–77. [DOI] [PubMed] [Google Scholar]
- Phillips J.; Eberwine J. H. Methods 1996, 10, 283–288. [DOI] [PubMed] [Google Scholar]
- Jonas P.; Racca C.; Sakmann B.; Seeburg P. H.; Monyer H. Neuron 1994, 12, 1281–1289. [DOI] [PubMed] [Google Scholar]
- Bochet P.; Audinat E.; Lambolez B.; Crépel F.; Rossier J.; Iino M.; Tsuzuki K.; Ozawa S. Neuron 1994, 12, 383–388. [DOI] [PubMed] [Google Scholar]
- Lambolez B.; Audinat E.; Bochet P.; Crépel F.; Rossier J. Neuron 1992, 9, 247–258. [DOI] [PubMed] [Google Scholar]
- Sucher N. J.; Deitcher D. L. Neuron 1995, 14, 1095–1100. [DOI] [PubMed] [Google Scholar]
- Tsuyama N.; Mizuno H.; Tokunaga E.; Masujima T. Anal. Sci. 2008, 24, 559–561. [DOI] [PubMed] [Google Scholar]
- Mizuno H.; Tsuyama N.; Date S.; Harada T.; Masujima T. Anal. Sci. 2008, 24, 1525–1527. [DOI] [PubMed] [Google Scholar]
- Li L.; Sweedler J. V. Annu. Rev. Anal. Chem. 2008, 1, 451–483. [DOI] [PubMed] [Google Scholar]
- Rubakhin S. S.; Lanni E. J.; Sweedler J. V. Curr. Opin. Biotechnol. 2013, 24, 95–104. [DOI] [PMC free article] [PubMed] [Google Scholar]
- Rubakhin S. S.; Garden R. W.; Fuller R. R.; Sweedler J. V. Nat. Biotechnol. 2000, 18, 172–175. [DOI] [PubMed] [Google Scholar]
- Lapainis T.; Rubakhin S. S.; Sweedler J. V. Anal. Chem. 2009, 81, 5858–5864. [DOI] [PMC free article] [PubMed] [Google Scholar]
- Nemes P.; Knolhoff A. M.; Rubakhin S. S.; Sweedler J. V. Anal. Chem. 2011, 83, 6810–6817. [DOI] [PMC free article] [PubMed] [Google Scholar]
- Nemes P.; Knolhoff A. M.; Rubakhin S. S.; Sweedler J. V. ACS Chem. Neurosci. 2012, 3, 782–792. [DOI] [PMC free article] [PubMed] [Google Scholar]
- Knolhoff A. M.; Nautiyal K. M.; Nemes P.; Kalachikov S.; Morozova I.; Silver R.; Sweedler J. V. Anal. Chem. 2013, 85, 3136–3143. [DOI] [PMC free article] [PubMed] [Google Scholar]
- Crandall S. R.; Cox C. L. J. Neurosci. 2012, 32, 2513–2522. [DOI] [PMC free article] [PubMed] [Google Scholar]
- Crandall S. R.; Cox C. L. J. Neurophysiol. 2013, 110, 470–480. [DOI] [PMC free article] [PubMed] [Google Scholar]
- Govindaiah G.; Cox C. L. J. Neurosci. 2006, 26, 13443–13453. [DOI] [PMC free article] [PubMed] [Google Scholar]
- Nemes P.; Rubakhin S. S.; Aerts J. T.; Sweedler J. V. Nat. Protoc. 2013, 8, 783–799. [DOI] [PMC free article] [PubMed] [Google Scholar]
- Smith C. A.; O’Maille G.; Want E. J.; Qin C.; Trauger S. A.; Brandon T. R.; Custodio D. E.; Abagyan R.; Siuzdak G. Ther. Drug Monit. 2005, 27, 747–751. [DOI] [PubMed] [Google Scholar]
- Wishart D. S.; Knox C.; Guo A. C.; Eisner R.; Young N.; Gautam B.; Hau D. D.; Psychogios N.; Dong E.; Bouatra S.; Mandal R.; Sinelnikov I.; Xia J. G.; Jia L.; Cruz J. A.; Lim E.; Sobsey C. A.; Shrivastava S.; Huang P.; Liu P.; Fang L.; Peng J.; Fradette R.; Cheng D.; Tzur D.; Clements M.; Lewis A.; De Souza A.; Zuniga A.; Dawe M.; Xiong Y. P.; Clive D.; Greiner R.; Nazyrova A.; Shaykhutdinov R.; Li L.; Vogel H. J.; Forsythe I. Nucleic Acids Res. 2009, 37, D603–D610. [DOI] [PMC free article] [PubMed] [Google Scholar]
- Sherman S. M.; Guillery R. W. J. Neurophysiol. 1996, 76, 1367–1395. [DOI] [PubMed] [Google Scholar]
- Avanzini G.; Panzica F.; de Curtis M. Clin. Neurophysiol. 2000, 111Supplement 2S19–S26. [DOI] [PubMed] [Google Scholar]
- McCormick D. A.; Bal T. Annu. Rev. Neurosci. 1997, 20, 185–215. [DOI] [PubMed] [Google Scholar]
- Houser C. R.; Vaughn J. E.; Barber R. P.; Roberts E. Brain Res. 1980, 200, 341–354. [DOI] [PubMed] [Google Scholar]
- Neupert S.; Rubakhin S. S.; Sweedler J. V. Chem. Biol. 2012, 19, 1010–1019. [DOI] [PMC free article] [PubMed] [Google Scholar]
- Jing J. A.; Sweedler J. V.; Cropper E. C.; Alexeeva V.; Park J. H.; Romanova E. V.; Xie F.; Dembrow N. C.; Ludwar B. C.; Weiss K. R.; Vilim F. S. J. Neurosci. 2010, 30, 16545–16558. [DOI] [PMC free article] [PubMed] [Google Scholar]
- Diaz-Rios M.; Suess E.; Miller M. W. J. Comp. Neurol. 1999, 413, 255–270. [DOI] [PubMed] [Google Scholar]
- de Biasi S.; Frassoni C.; Spreafico R. Brain Res. 1986, 399, 143–147. [DOI] [PubMed] [Google Scholar]
- Yin P.; Knolhoff A. M.; Rosenberg H. J.; Millet L. J.; Gillette M. U.; Sweedler J. V. J. Proteome Res. 2012, 11, 3965–3973. [DOI] [PMC free article] [PubMed] [Google Scholar]
Associated Data
This section collects any data citations, data availability statements, or supplementary materials included in this article.


