
Fig. 4. Midshaft femur fluorochrome-derived BFRs on the periosteal surface collected from 16.5-week-old male Lrp5−/−, Sost−/−, and Lrp5−/−;Sost−/− mice.
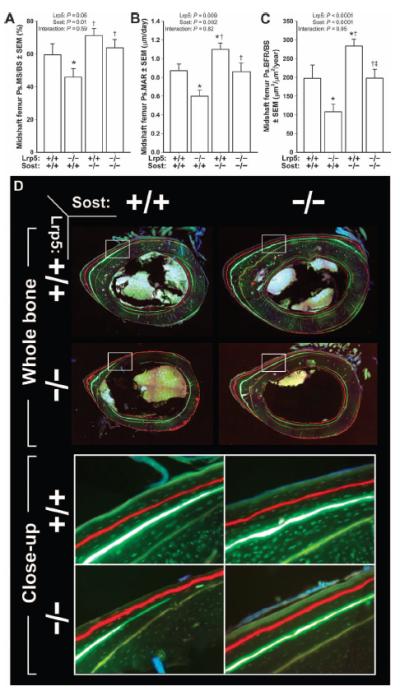
(A) Periosteal MS/BS (Ps.MS/BS). (B) Periosteal MAR (Ps.MAR). (C) Periosteal BFR per unit bone surface (Ps.BFR/BS). All three indices were derived using an oxytetracycline label given at 5 weeks of age [pale yellow label in (D)] and an alizarin complexone label given at 12 weeks of age [red label in (D)]. (D) Whole-bone (upper panels) and close-up (lower panels; taken from the white boxes indicated in the upper panels) photomicrographs of representative midshaft femur sections from each of the four genotypes studied. The data were analyzed by two-way ANOVA using Lrp5 and Sost genotypes as main effects [indicated at the top of panels (A) to (C)]. Post hoc tests were conducted using Fisher’s PLSD. *P < 0.05, significantly different from wild type; † P < 0.05, significantly different from Lrp5−/−; ‡P < 0.05, significantly different from Sost−/−. For each group, n = 8 mice.