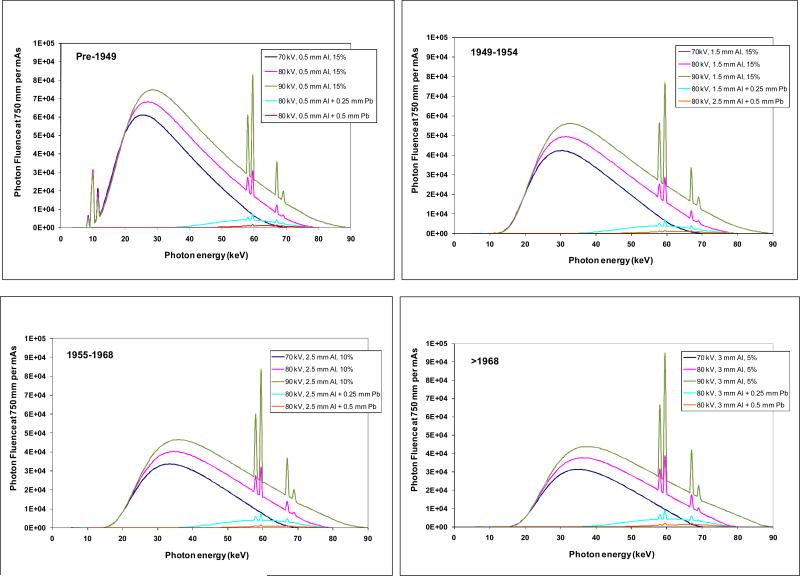
Fig. 1.
X-ray energy fluence spectra assumed for estimating organ doses from conducting radiography and fluoroscopy examinations in four time-periods: pre-1949 (top left), 1949-1954 (top right), 1955-1968 (bottom left), after 1968 (bottom right). The fluence spectra transmitted through a filter equal to the thickness of protective aprons is also shown (turquoise line is 0.25 mm Pb, red line is 0.5 mm Pb). Spectral data are from IPEM (1997).

