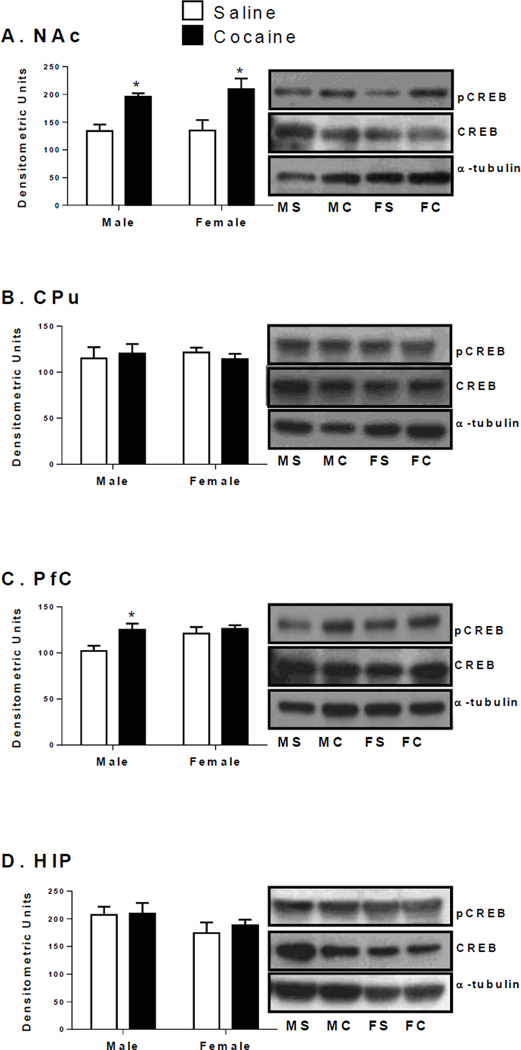
Figure 3.
Phosphorylated CREB protein levels (measured at 46 kDa) in the NAc (A), CPu (B), PfC (C), and HIP (D) of male and female rats after CPP testing. Phosphorylated protein levels are expressed as a ratio to their respective total protein levels (normalized to a tubulin, 55 kDa)(±SEM) (n = 4 animals per group). *Indicates significant difference from saline controls of the same sex at p < 0.05.

