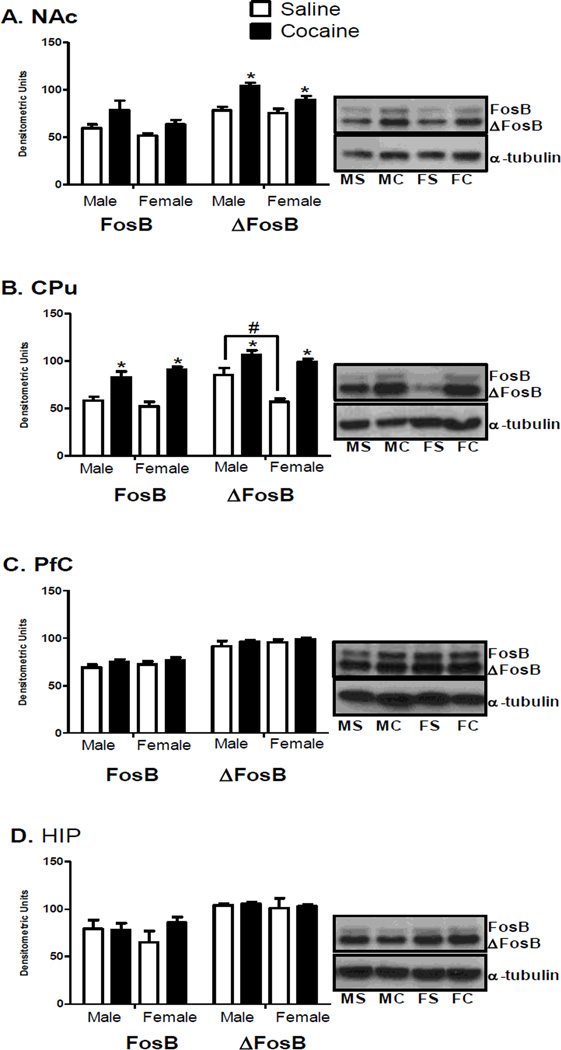
Figure 4.
FosB (left 4 bars, top band: 48 kDa) and ΔFosB (right 4 bars, bottom band: 38 kDa) protein levels in the NAc (A), CPu (B), PfC (C), and HIP (D) of male and female saline and cocaine rats after CPP testing. Protein levels are expressed as a ratio to their respective a tubulin levels (55 kDa) (±SEM) (n = 4 animals per group). *Indicates significant difference from saline controls of the same sex at p < 0.05. #Indicates significant difference between male and female saline animals at p < 0.05.

