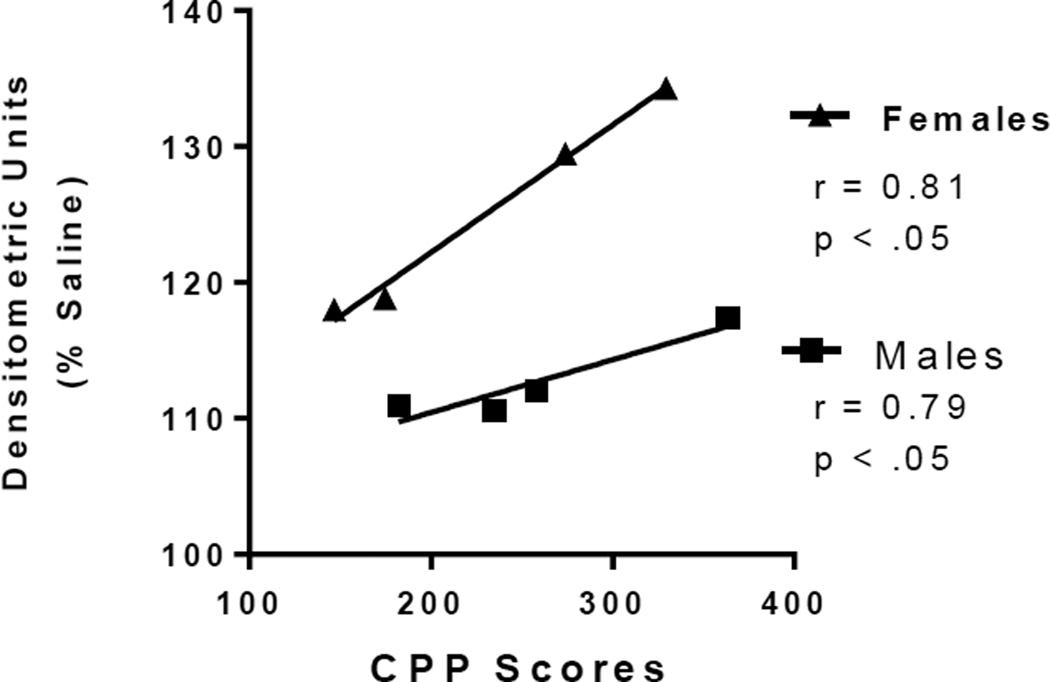
Figure 5.
Representative scatter plot of correlations between CPP scores and phosphoprotein levels. NAc pERK protein levels (expressed as a percentage of saline controls) were significantly correlated to CPP scores in both male (squares) and female (triangles) cocaine treated rats (n = 4 animals per group). The Pearson correlation coefficients and p-values are displayed within the plot.

