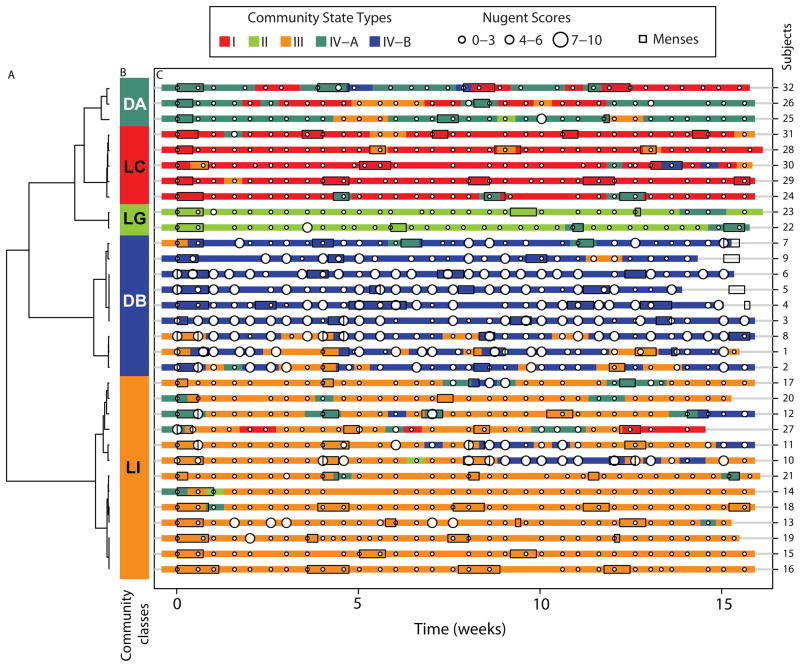
Figure 5.
Profiles of community state types, Nugent scores and menses for 32 women over a 16 week period. (A) Dendogram of distances between proportions of the five communities state types identified and measured within a woman over time. (B) Color bar indicates community class designation and is defined by clusters of proportions of community state types within a woman over time. (C) Profiles of community state types in which Nugent scores have been superimposed. Menses for each woman are indicated by boxes. Each time point is represented by a color-coded community state type (color key on top). Reproduced with permission from Science Translational Medicine.[54]

