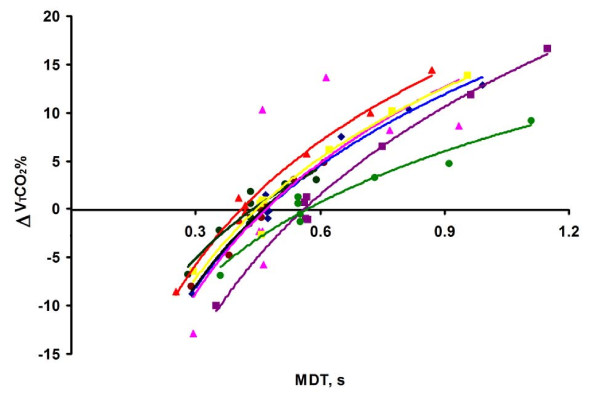
Figure 4.

Effects of TP variation. When only TP was modified, ΔVTCO2% increased with MDT, shown by different colors for each patient. Each dot represents one breath. To illustrate the close correlation between ΔVTCO2% and lnMDT, lines for each subject represent the relation: ΔVTCO2% = m × lnMDT + n.
