Figure 5.

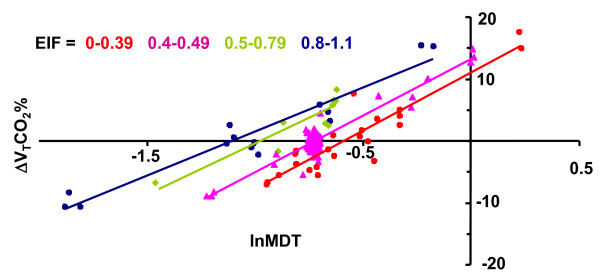
ΔVTCO2% plotted against lnMDT in subject 4. Groups of breaths with EIF within specified ranges are indicated by separate colors. For each range of EIF, a linear relation between lnMDT and ΔVTCO2% was observed.

ΔVTCO2% plotted against lnMDT in subject 4. Groups of breaths with EIF within specified ranges are indicated by separate colors. For each range of EIF, a linear relation between lnMDT and ΔVTCO2% was observed.