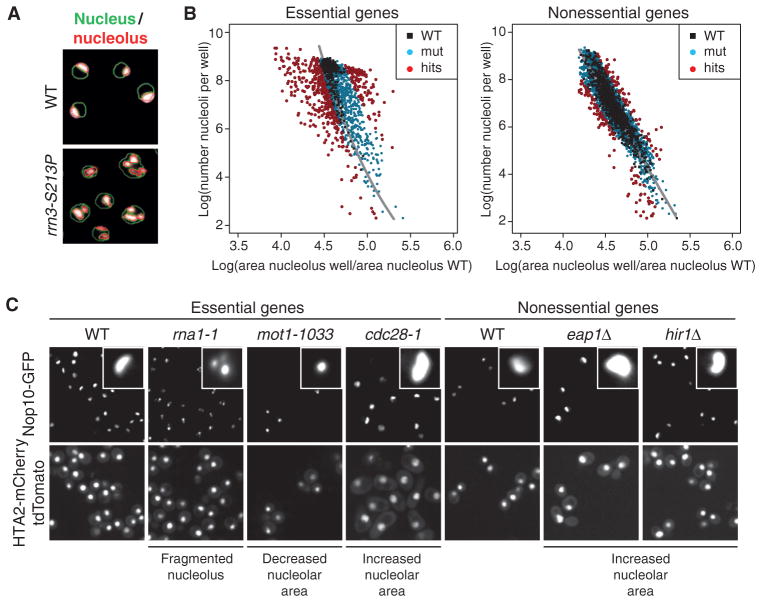
Fig. 1. SGA screen for nucleolar defects in S. cerevisiae.
(A) Computer-based detection of nuclear (green outlines) and nucleolar (red outlines) size and morphology changes in the RNA Pol I transcription initiation mutant rrn3-S213P or wild-type (WT) cells. Images are representative of four independent biological replicates. (B) Scatter plot illustrating the dependence of nucleolar area [x axis: (per plate) normalized nucleolar area] on cell number (number of nucleoli per well). Black dots, WT control wells; blue dots, loss-of-function alleles that are similar to WT; red dots, wells that were classified as phenotypes based on their localization outside the WT region. Phenotypic strength was calculated as the distance to the regression line (gray). (C) Representative examples of different nucleolar phenotypes in the essential and nonessential gene set collections (close-ups show individual representative nucleoli of the respective genotype). Images are representative of four independent biological replicates.

