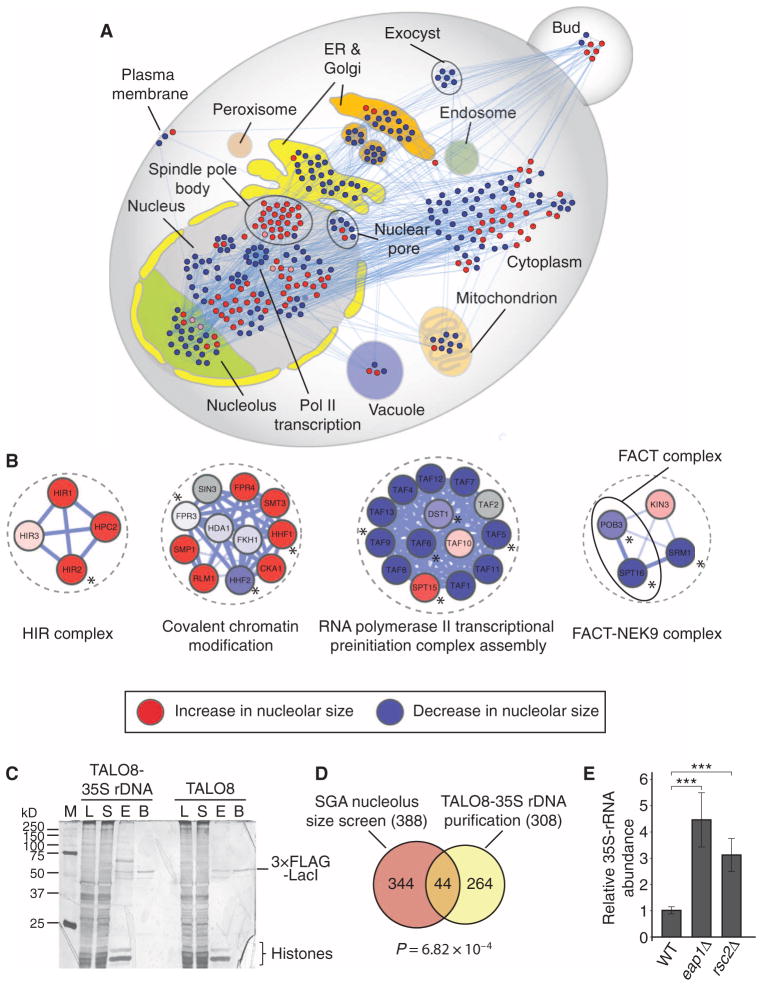
Fig. 2. Identification of direct regulators of rDNA transcription through promoter proteomics in S. cerevisiae.
(A) Subcellular localization of proteins whose corresponding genes resulted in a decrease (blue nodes) or an increase (red nodes) of nucleolar size upon loss of function. (B) Examples of molecular complexes implicated in transcriptional processes identified in the SGA screen [red: increase in nucleolar size, blue: decrease in nucleolar size (color intensity correlates with nucleolar size phenotypic strength), gray: not screened; asterisks denote proteins identified in the TALO8 purification]. (C) Representative silver-stained polyacrylamide gel of the purified proteins associated with TALO8 and TALO8–35S rDNA (M, marker; L, lysate; S, supernatant; E, eluate; B, beads). Images are representative of two independent biological replicates. (D) Venn diagram representing the overlap between SGA screen and TALO8 purification. P value (P = 6.82 × 10⁻⁴) was calculated using a hypergeometric test. (E) 35S pre-rRNA abundance is significantly increased in eap1 and rsc2 mutants compared to WT as measured by qRT-PCR. Bars represent the means ± SD of five independent biological replicates. ***P < 0.001.

